Figure 3. Volcano plot. The log2-transformed abundance ratio (ranibizumab/NaCl) for each protein is plotted on the x-axis. Negative
log10 transformed p values from the Student t-test are plotted on the y-axis. Statistically significantly regulated proteins
are located above the horizontal line, which denotes a significance level of 0.05. The components of ranibizumab are not included
in the volcano plot.
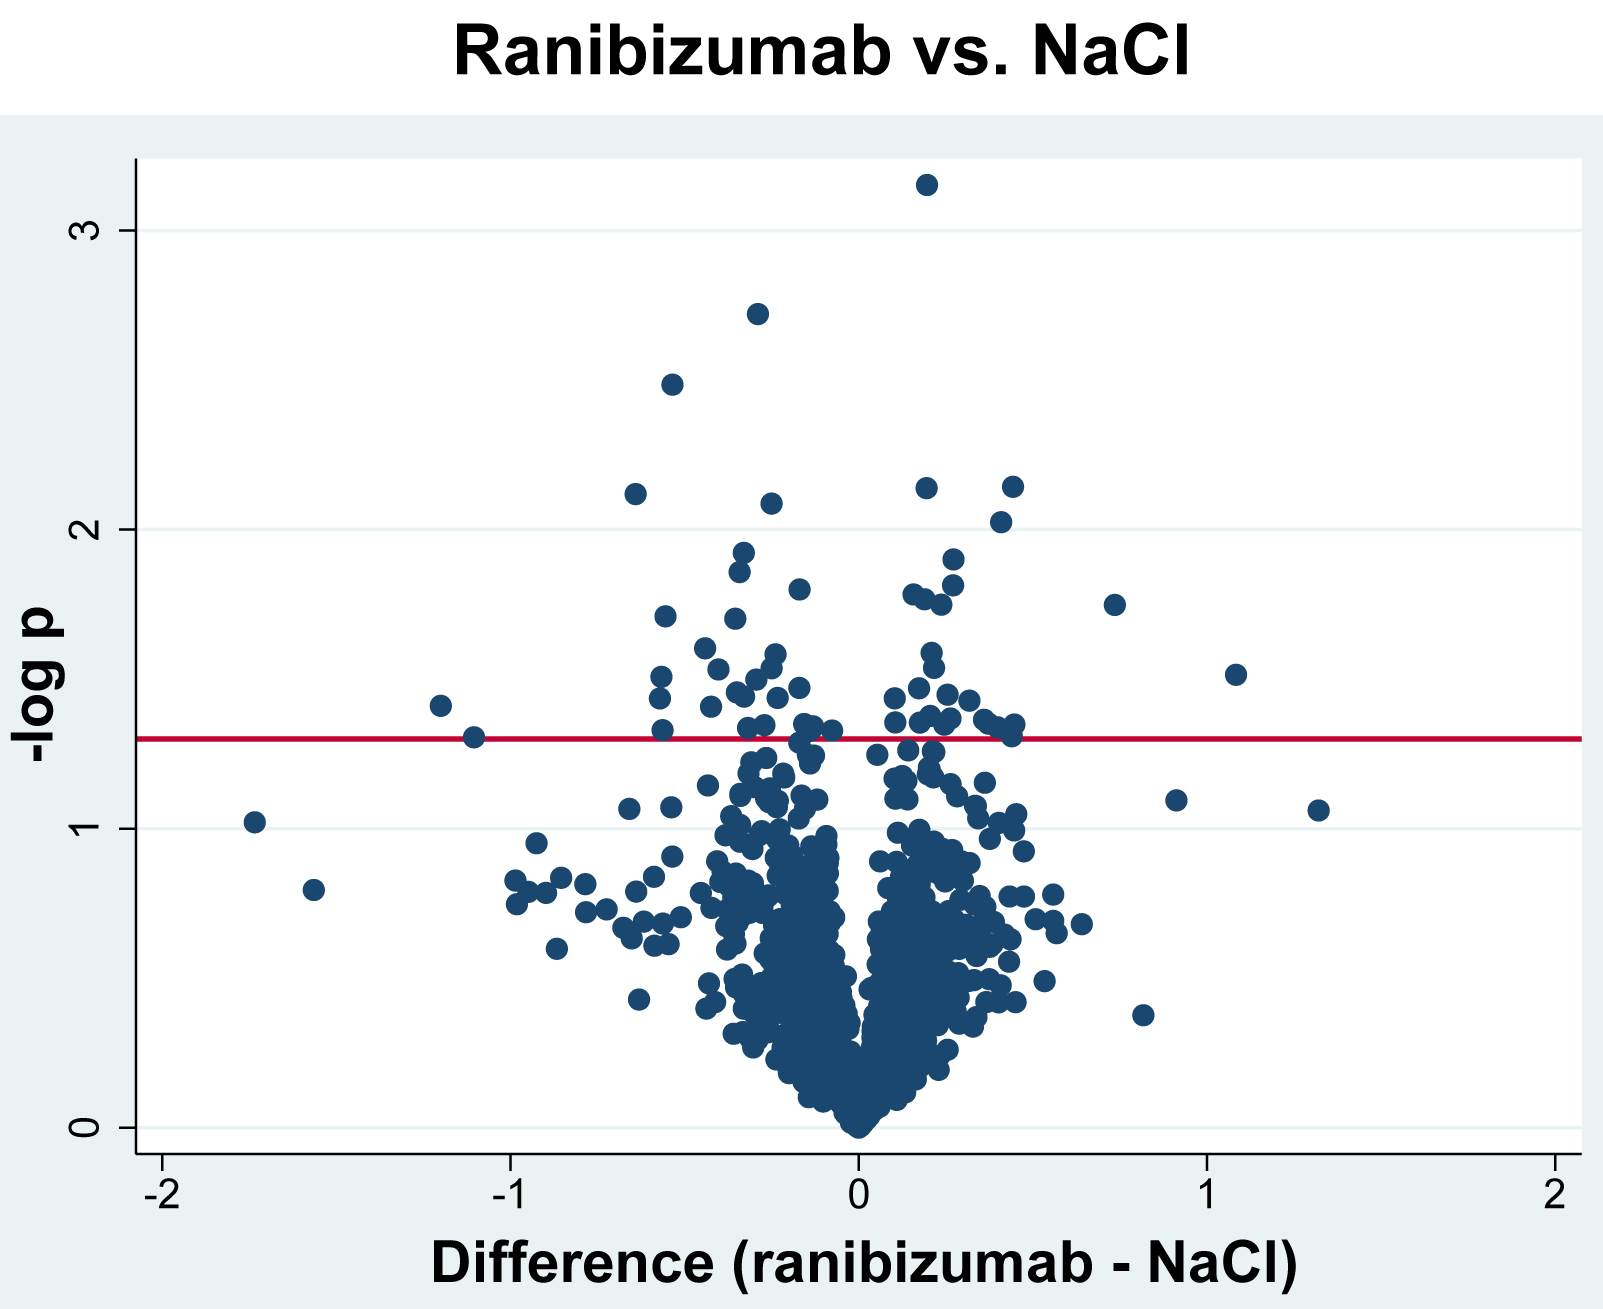
 Figure 3 of
Cehofski, Mol Vis 2024; 30:268-277.
Figure 3 of
Cehofski, Mol Vis 2024; 30:268-277.