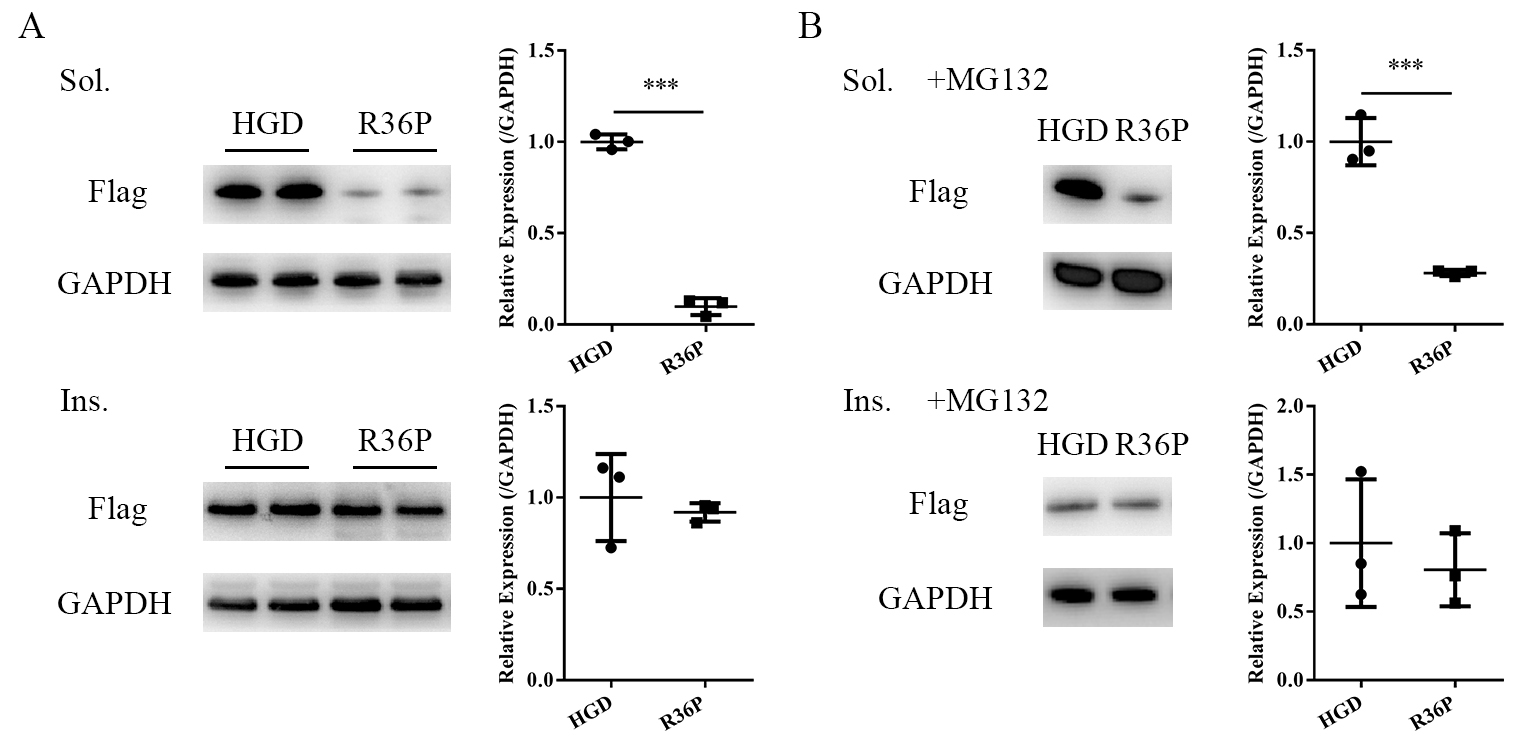
Figure 4. The expression levels of soluble and insoluble flag-tagged proteins in SRA 01/04 cells. A: Western blot and semi-quantification of soluble and insoluble flag-tagged proteins. (***p<0.001, Student’s t test, n=3). B: Western blot and semi-quantification of soluble and insoluble flag-tagged proteins after treatment with proteasome inhibitor
MG132 (***p<0.001, Student’s t test, n=3).

 Figure 4 of
Tan, Mol Vis 2024; 30:260-267.
  Figure 4 of
Tan, Mol Vis 2024; 30:260-267.