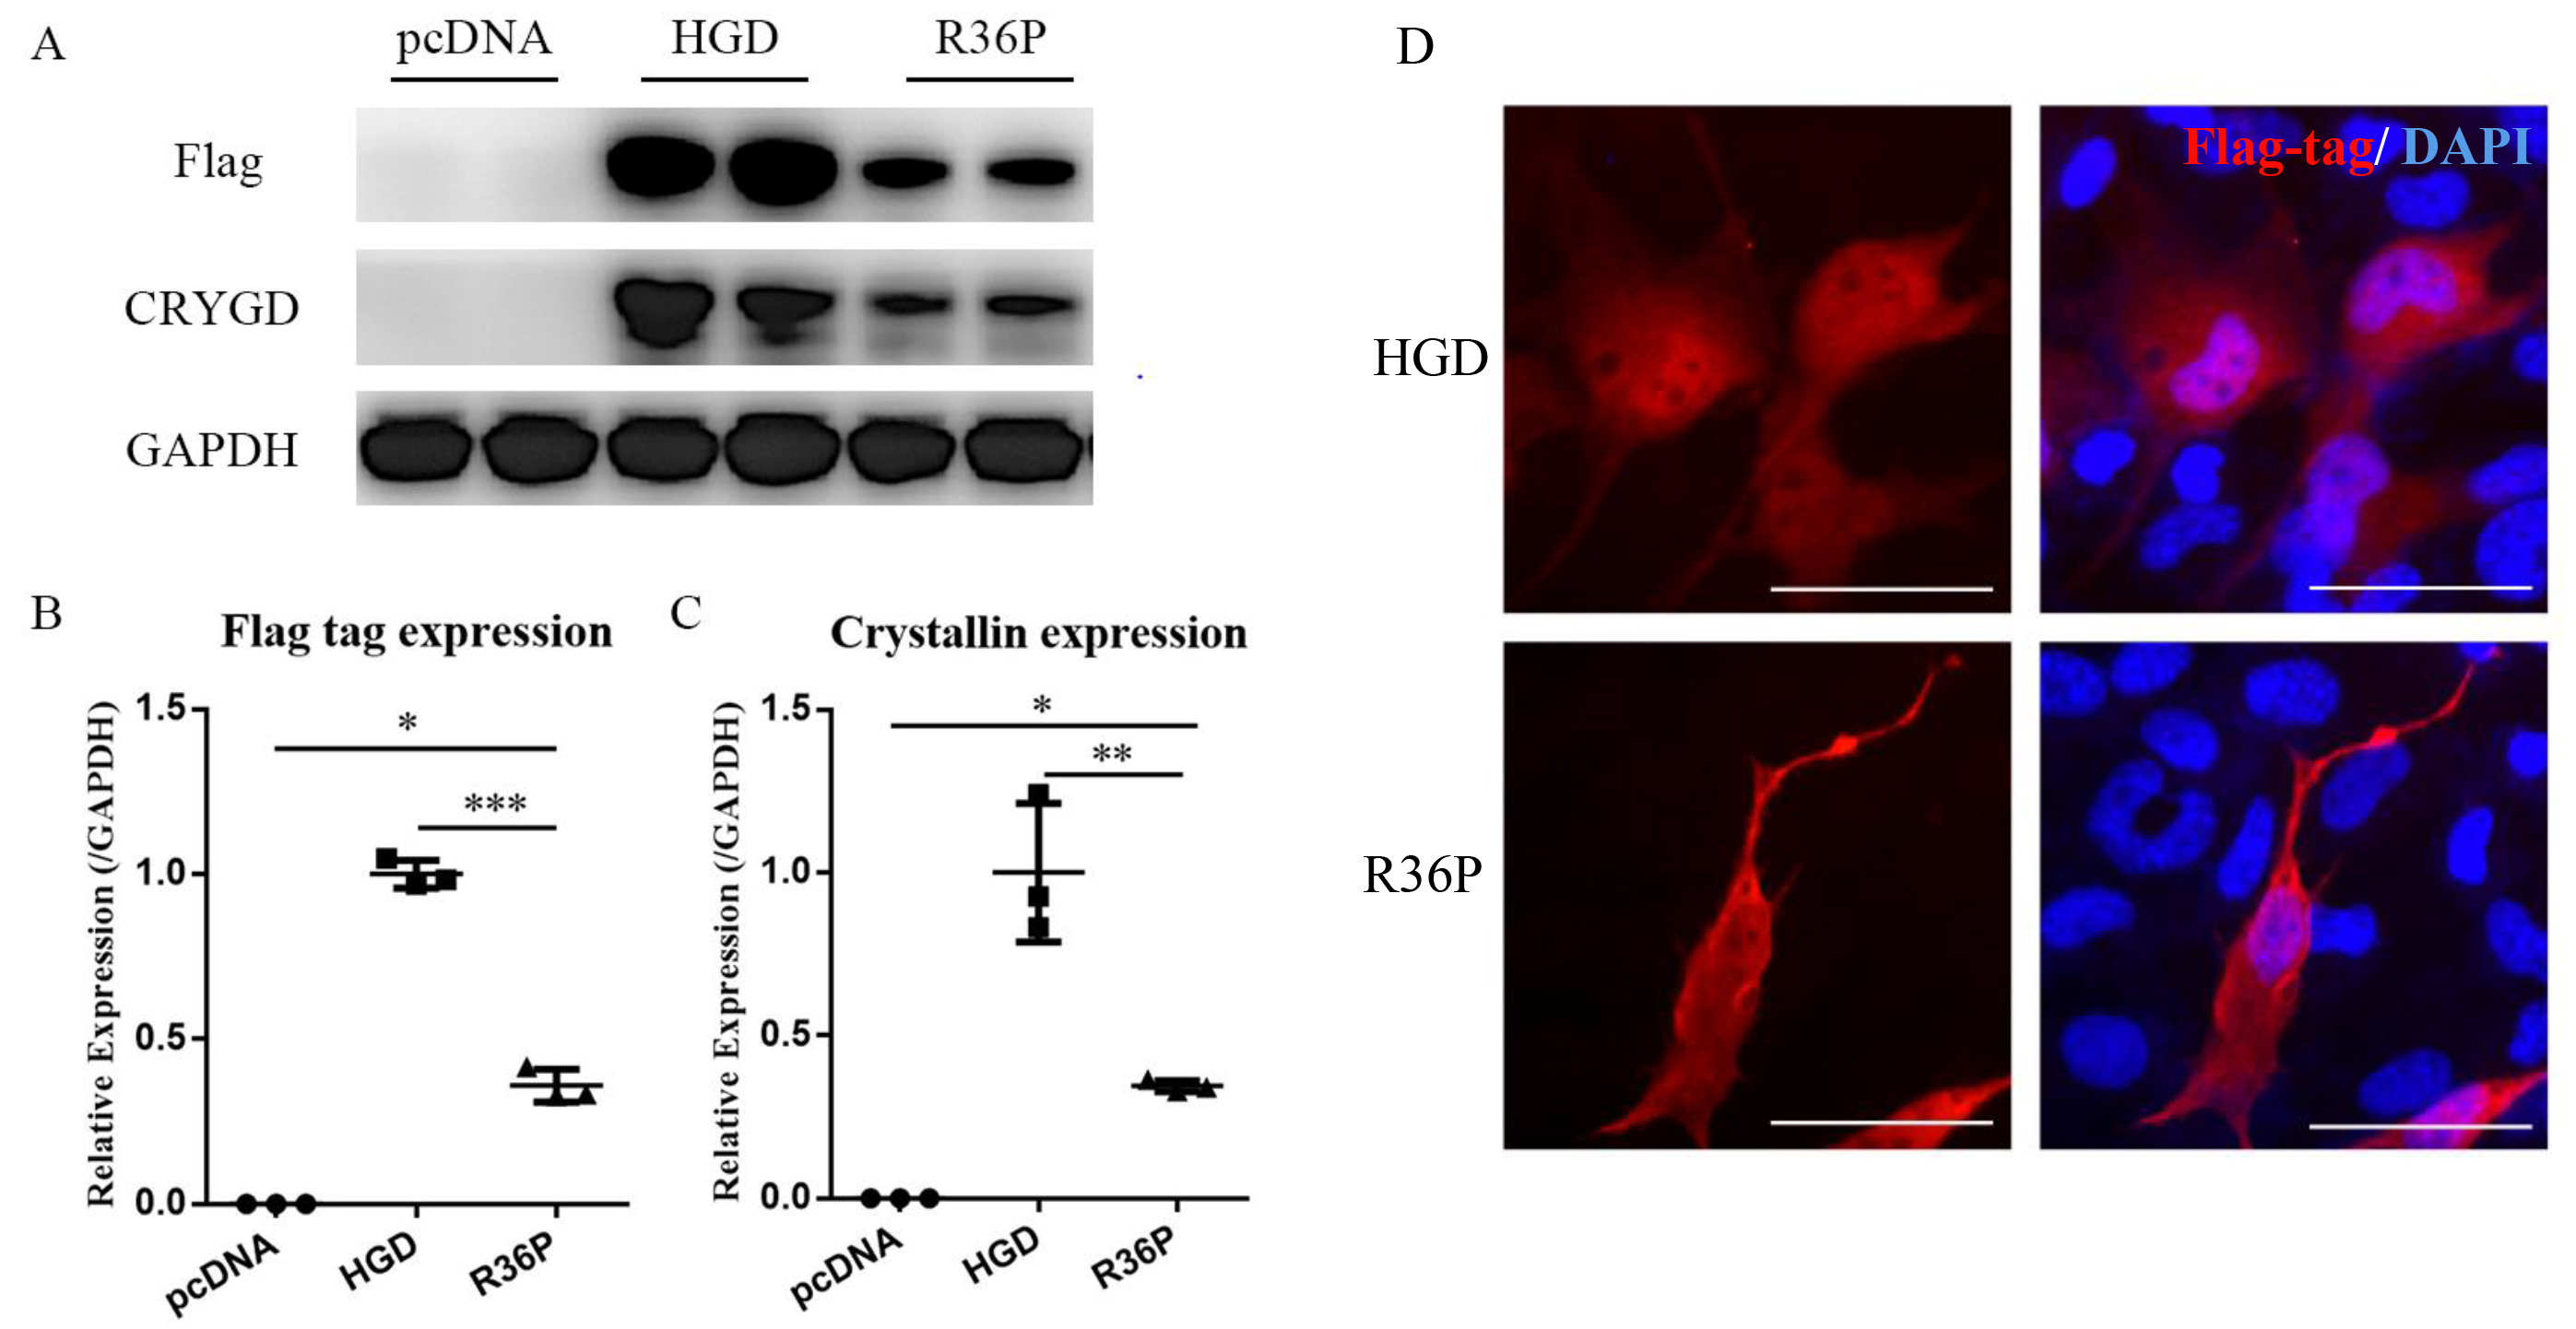
Figure 3. Effect of R36P mutation on SRA 01/04 cells. A: Western blot of the whole-cell lysis from transfected SRA 01/04 cells. B, C: Densitometry analysis of the relative protein expression levels of flag-tagged γD-crystallin (*p<0.05, **p<0.01, ***p<0.001,
Kruskal–Wallis test, n=3). D: Immunocytochemistry images of transfected SRA cells. The tagged proteins were stained with red fluorescence, and the nuclei
were visualized using DAPI (blue). Representative photos of triplicates are shown. Scale bar: 50 μm.

 Figure 3 of
Tan, Mol Vis 2024; 30:260-267.
  Figure 3 of
Tan, Mol Vis 2024; 30:260-267.