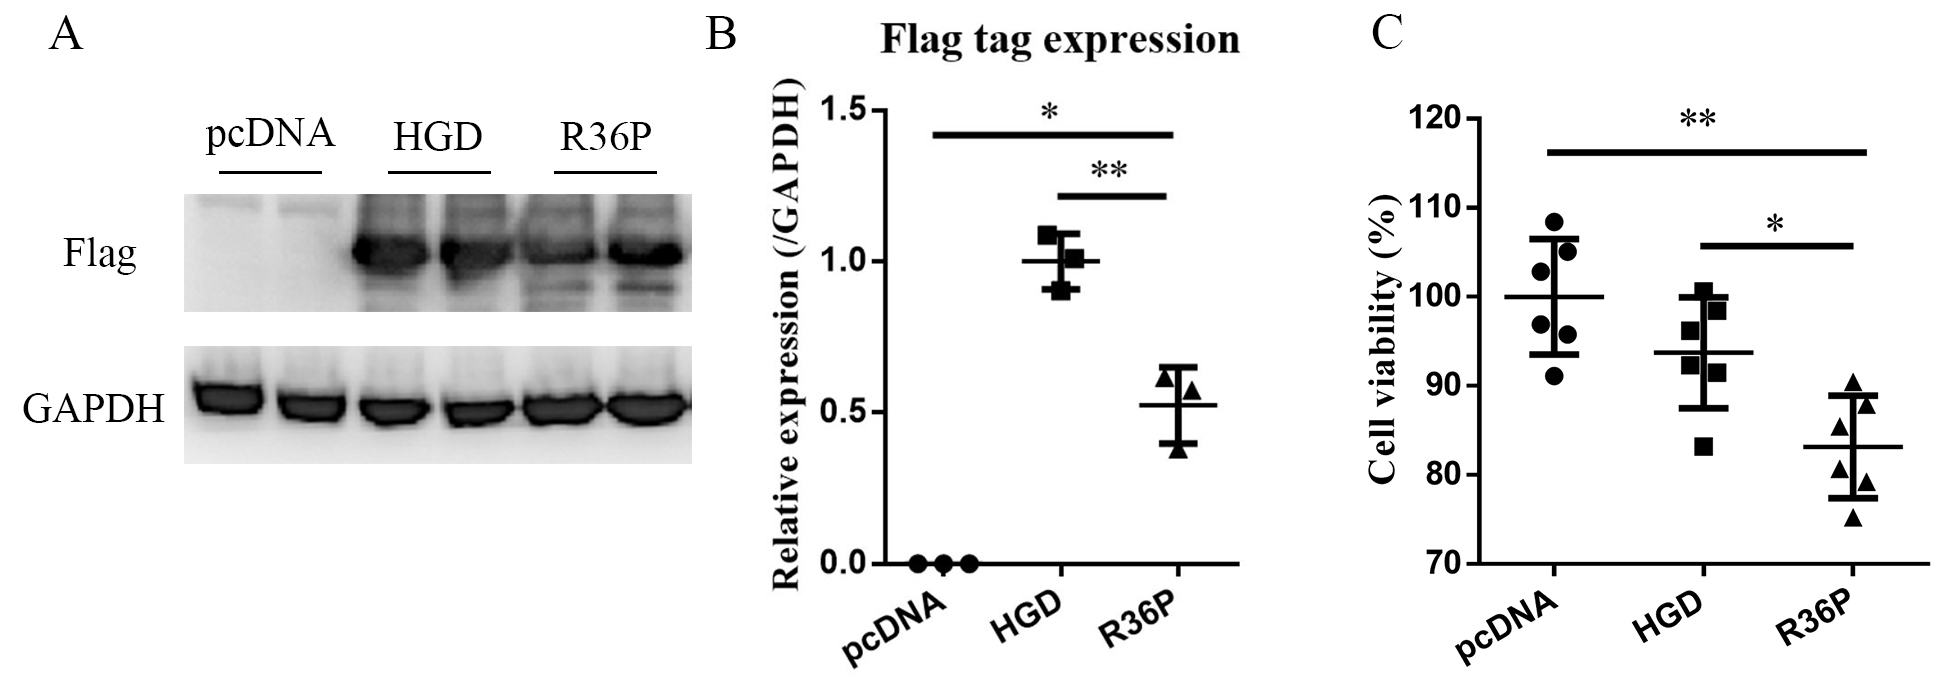
Figure 2. Effect of R36P mutation on protein expression levels and cell viability in HEK293T cells. A: SDS–PAGE analysis of protein labeled with flag tag. B: Densitometry analysis of the relative protein expression of flag-tagged γD-crystallin (*p<0.05, Kruskal–Wallis test, n=3).
C: Cell viability of the HEK293T cells after transfection for 48 h (**p<0.01, one-way ANOVA, n=6).

 Figure 2 of
Tan, Mol Vis 2024; 30:260-267.
  Figure 2 of
Tan, Mol Vis 2024; 30:260-267.