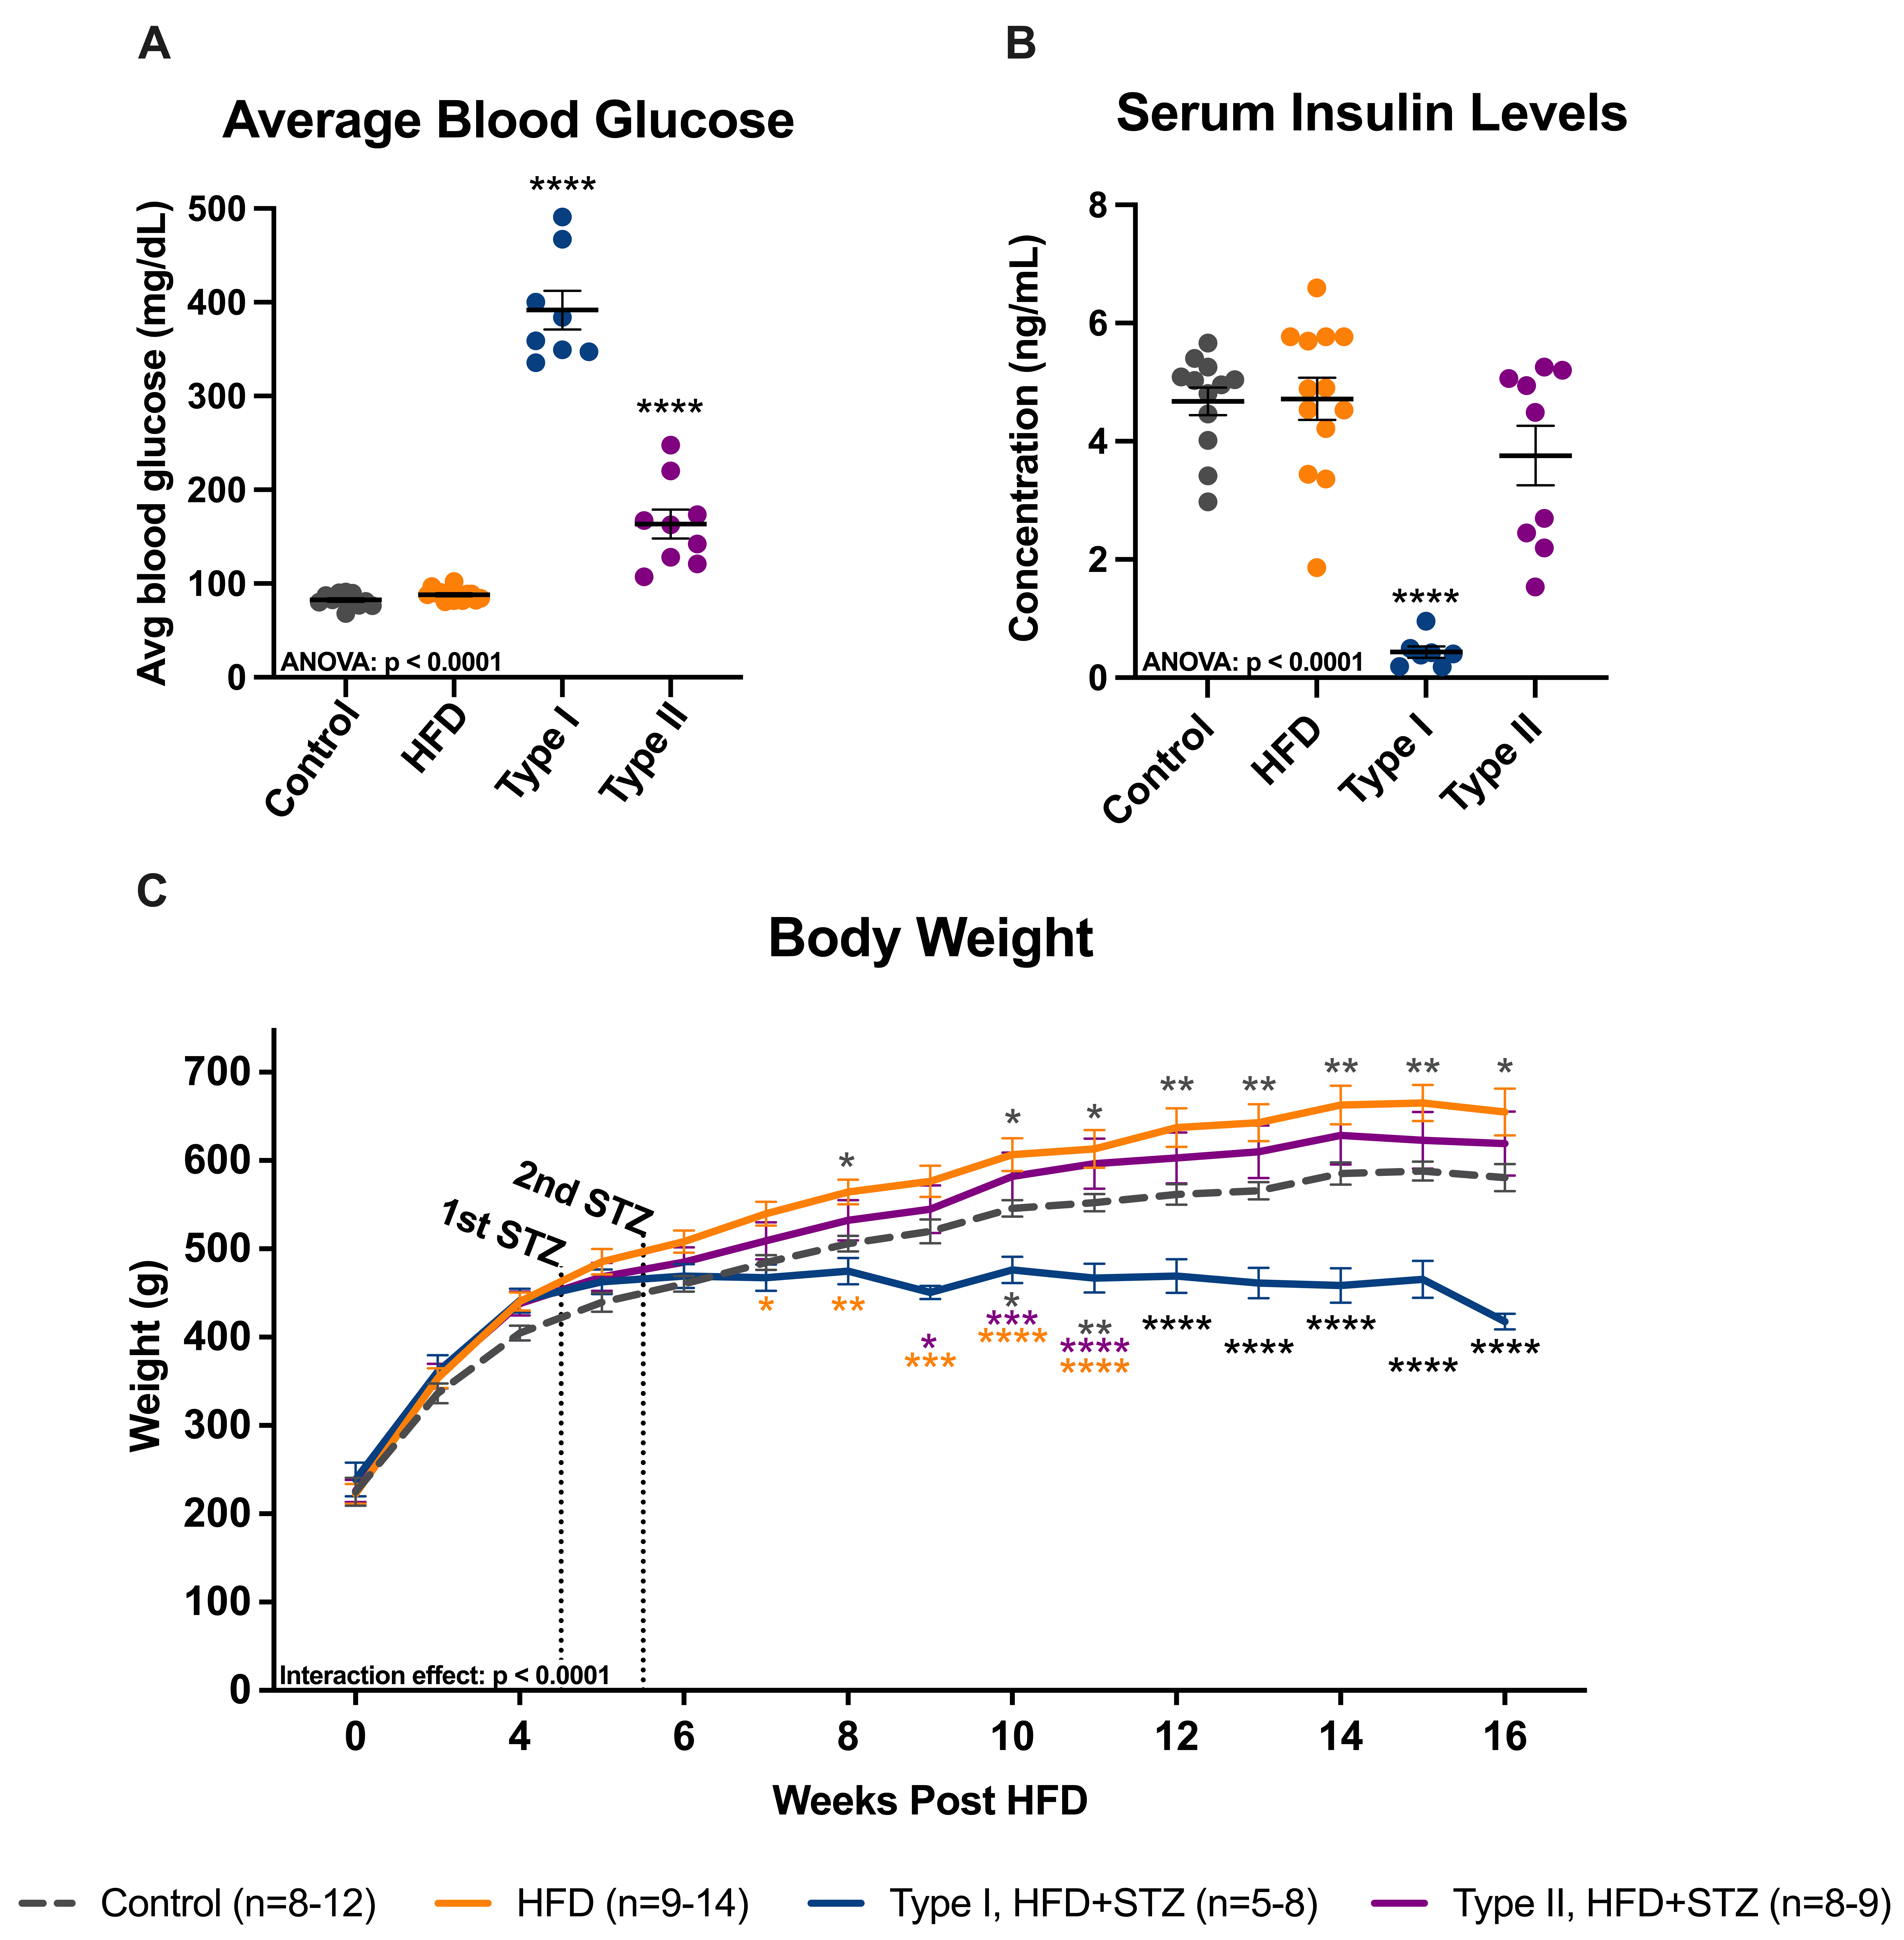
Figure 3. Type II rats maintained a normal bodyweight, were moderately hyperglycemic, and had no significant drop in serum insulin levels.
A: Average blood glucose levels from weekly measurements. B: Serum insulin levels detected by an ELISA from serum collected post-euthanasia. C: Weights of rats taken weekly. The colored asterisks correspond to a significant difference with the group that shares the
color of the asterisks. Black asterisks mean a significant difference with every other group. * p<0.05, ** p<0.01, *** p<0.001,
**** p<0.0001. Results expressed as mean ± SEM.

 Figure 3 of
Phillips, Mol Vis 2024; 30:239-259.
  Figure 3 of
Phillips, Mol Vis 2024; 30:239-259.