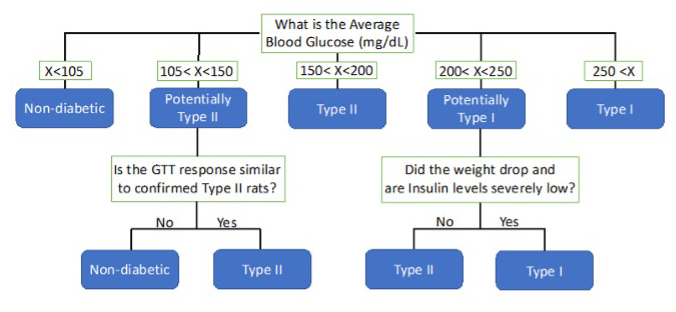
Figure 2. Flowchart for how diabetic rats were classified as Type I or Type II or non-diabetic. Biweekly blood glucose measurements
were averaged post-euthanasia. If the average blood glucose level was less than 105 mg/dl, the rat was classified as nondiabetic.
If the average blood glucose level was between 105 and 150 mg/dl, the glucose tolerance test results were used to determine
if the rat’s response was closer to the control group or the Type II group. If the average blood glucose level was between
150 to 200 mg/dl, the rat was classified as Type II. If the average blood glucose level was between 200 to 250 mg/dl, the
insulin levels and weight data were used. If the insulin levels were less than 1 ng/ml and the rat had a significantly lower
bodyweight, they were classified as Type I. However, if insulin levels and bodyweight did not significantly change the rat
was classified as Type II.

 Figure 2 of
Phillips, Mol Vis 2024; 30:239-259.
  Figure 2 of
Phillips, Mol Vis 2024; 30:239-259.