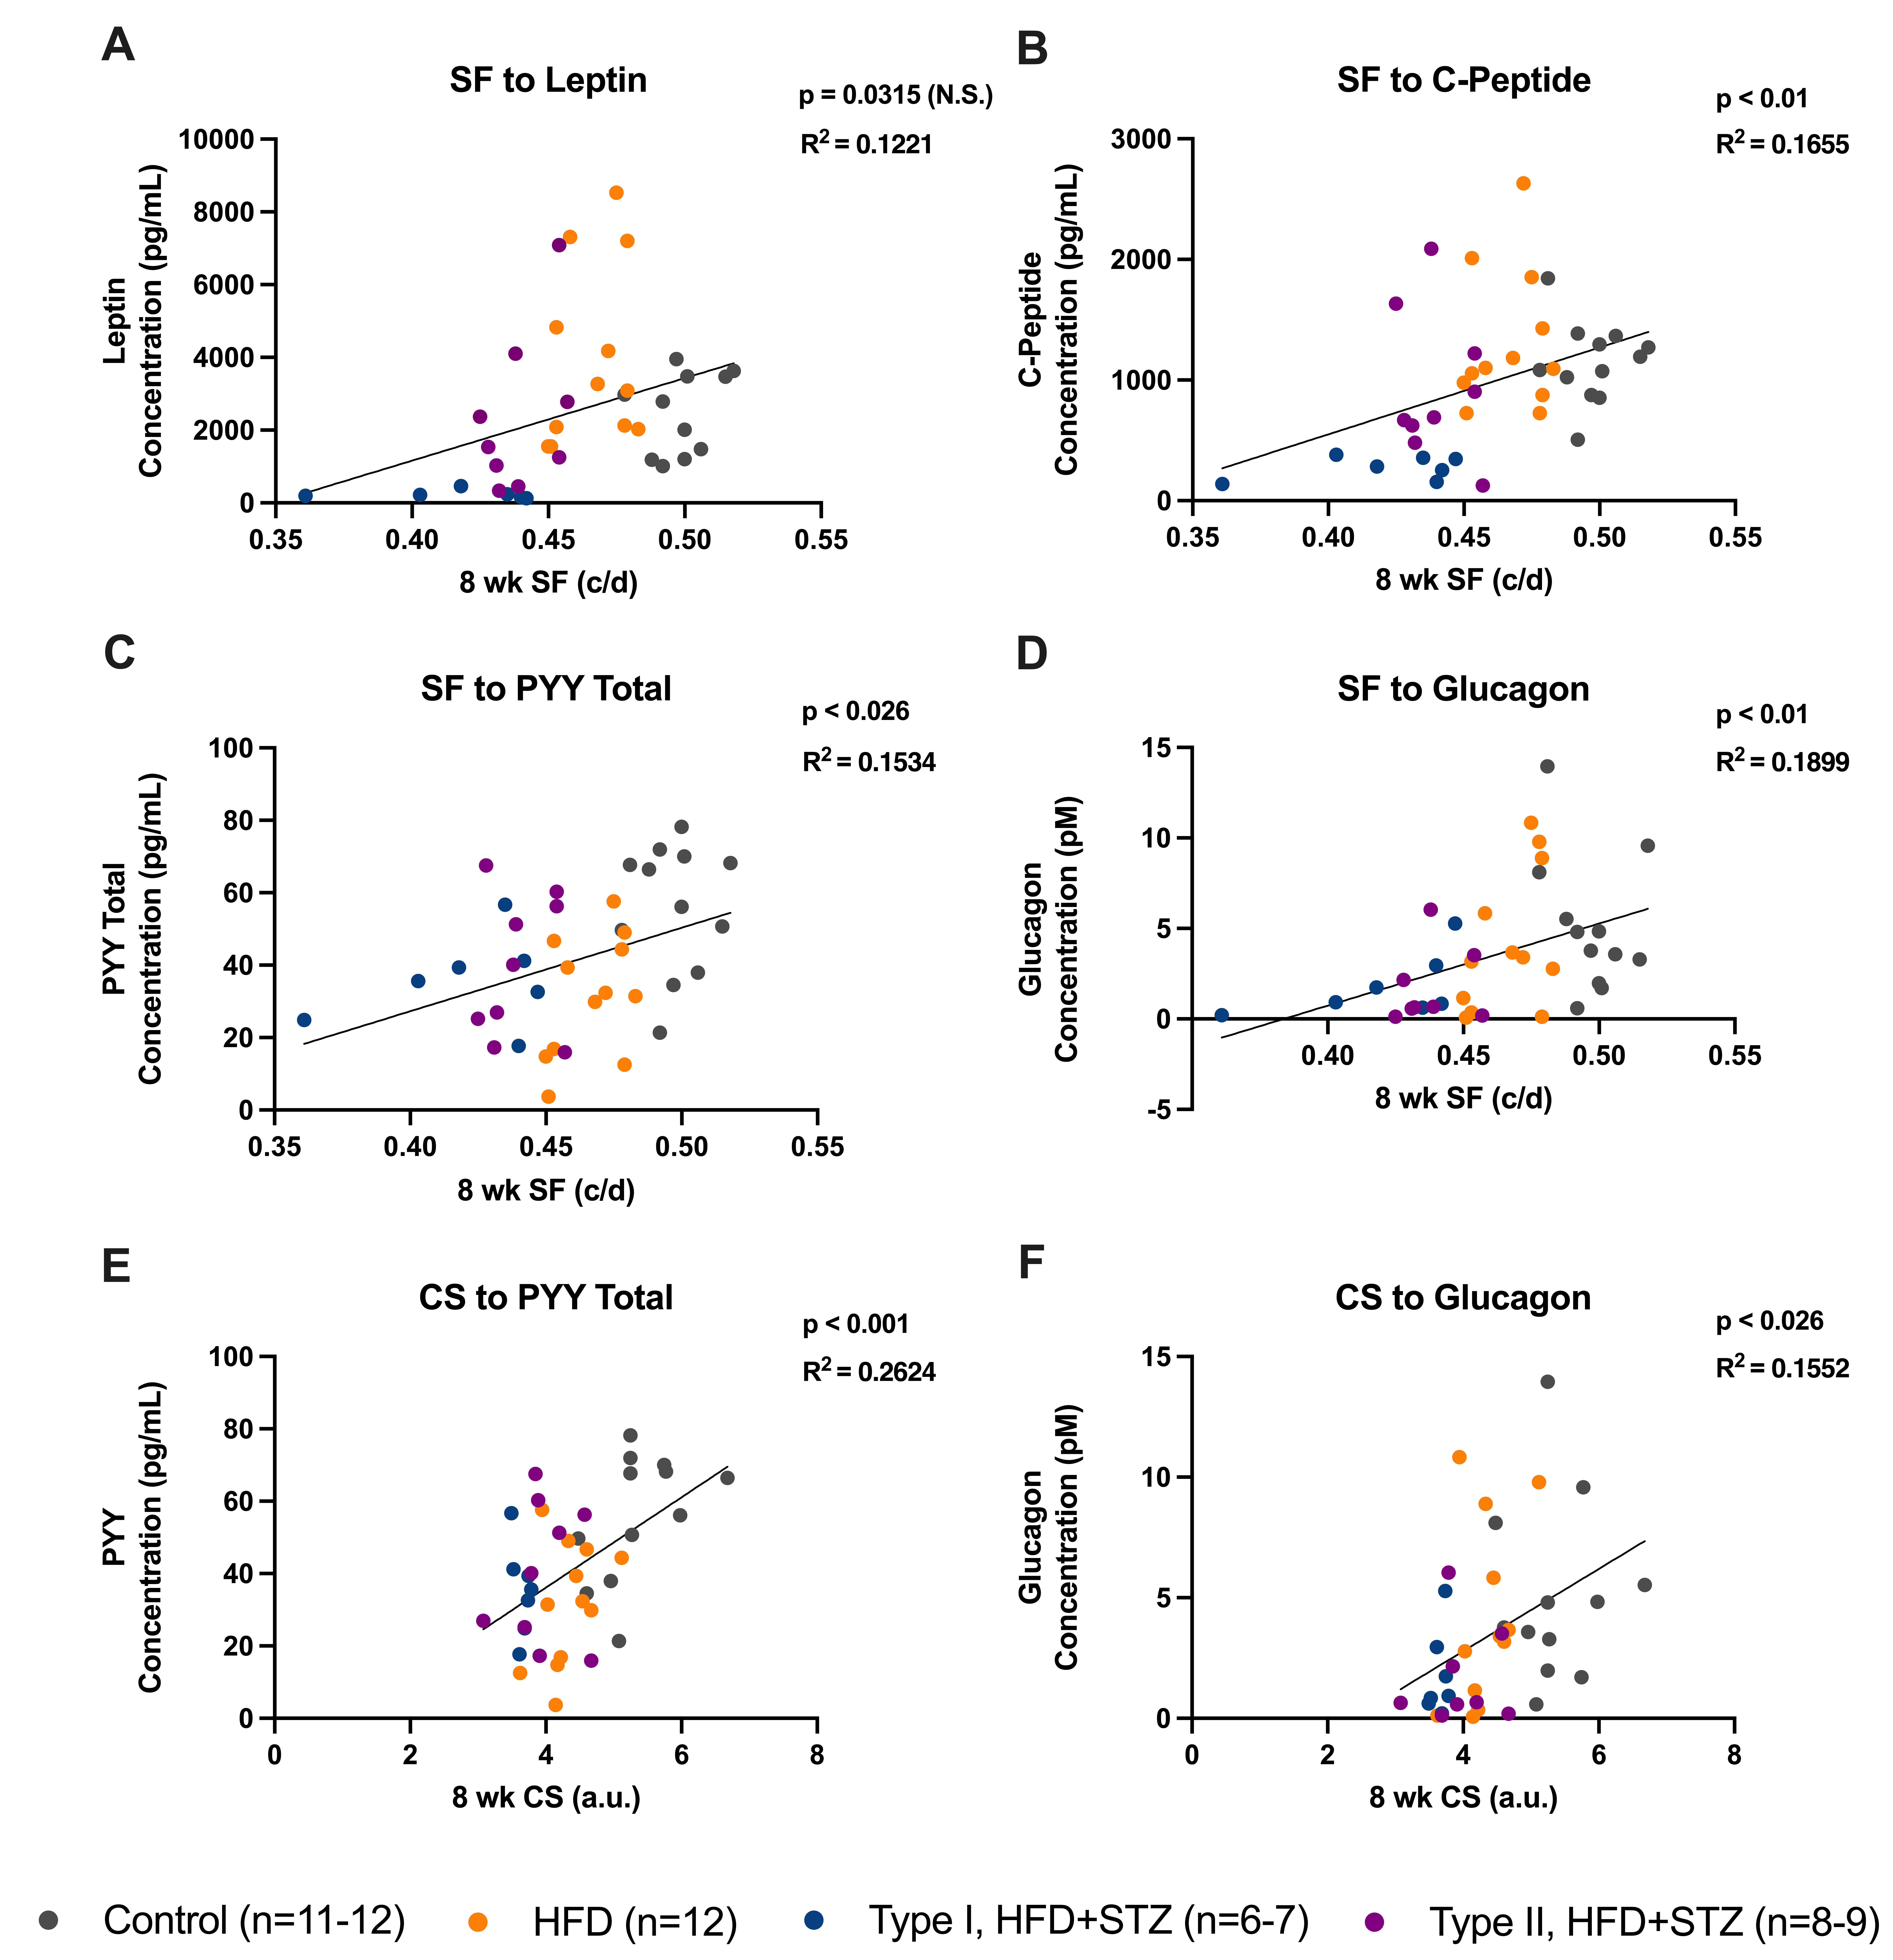
Figure 10. Serum biomarkers correlated with visual function changes, though effect sizes were small. Serum levels of metabolic biomarkers
correlated with visual function data acquired at 8 weeks post-hyperglycemia. Correlation of spatial frequency with leptin
(A), C-Peptide (B), PYY (C), and glucagon (D). Correlation of contrast sensitivity with PYY (E) and glucagon (F). Individual data points are shown for Type I HFD+STZ (blue), Type II HFD+STZ (pink), HFD only (yellow), and naïve control
(gray) groups.

 Figure 10 of
Phillips, Mol Vis 2024; 30:239-259.
  Figure 10 of
Phillips, Mol Vis 2024; 30:239-259.