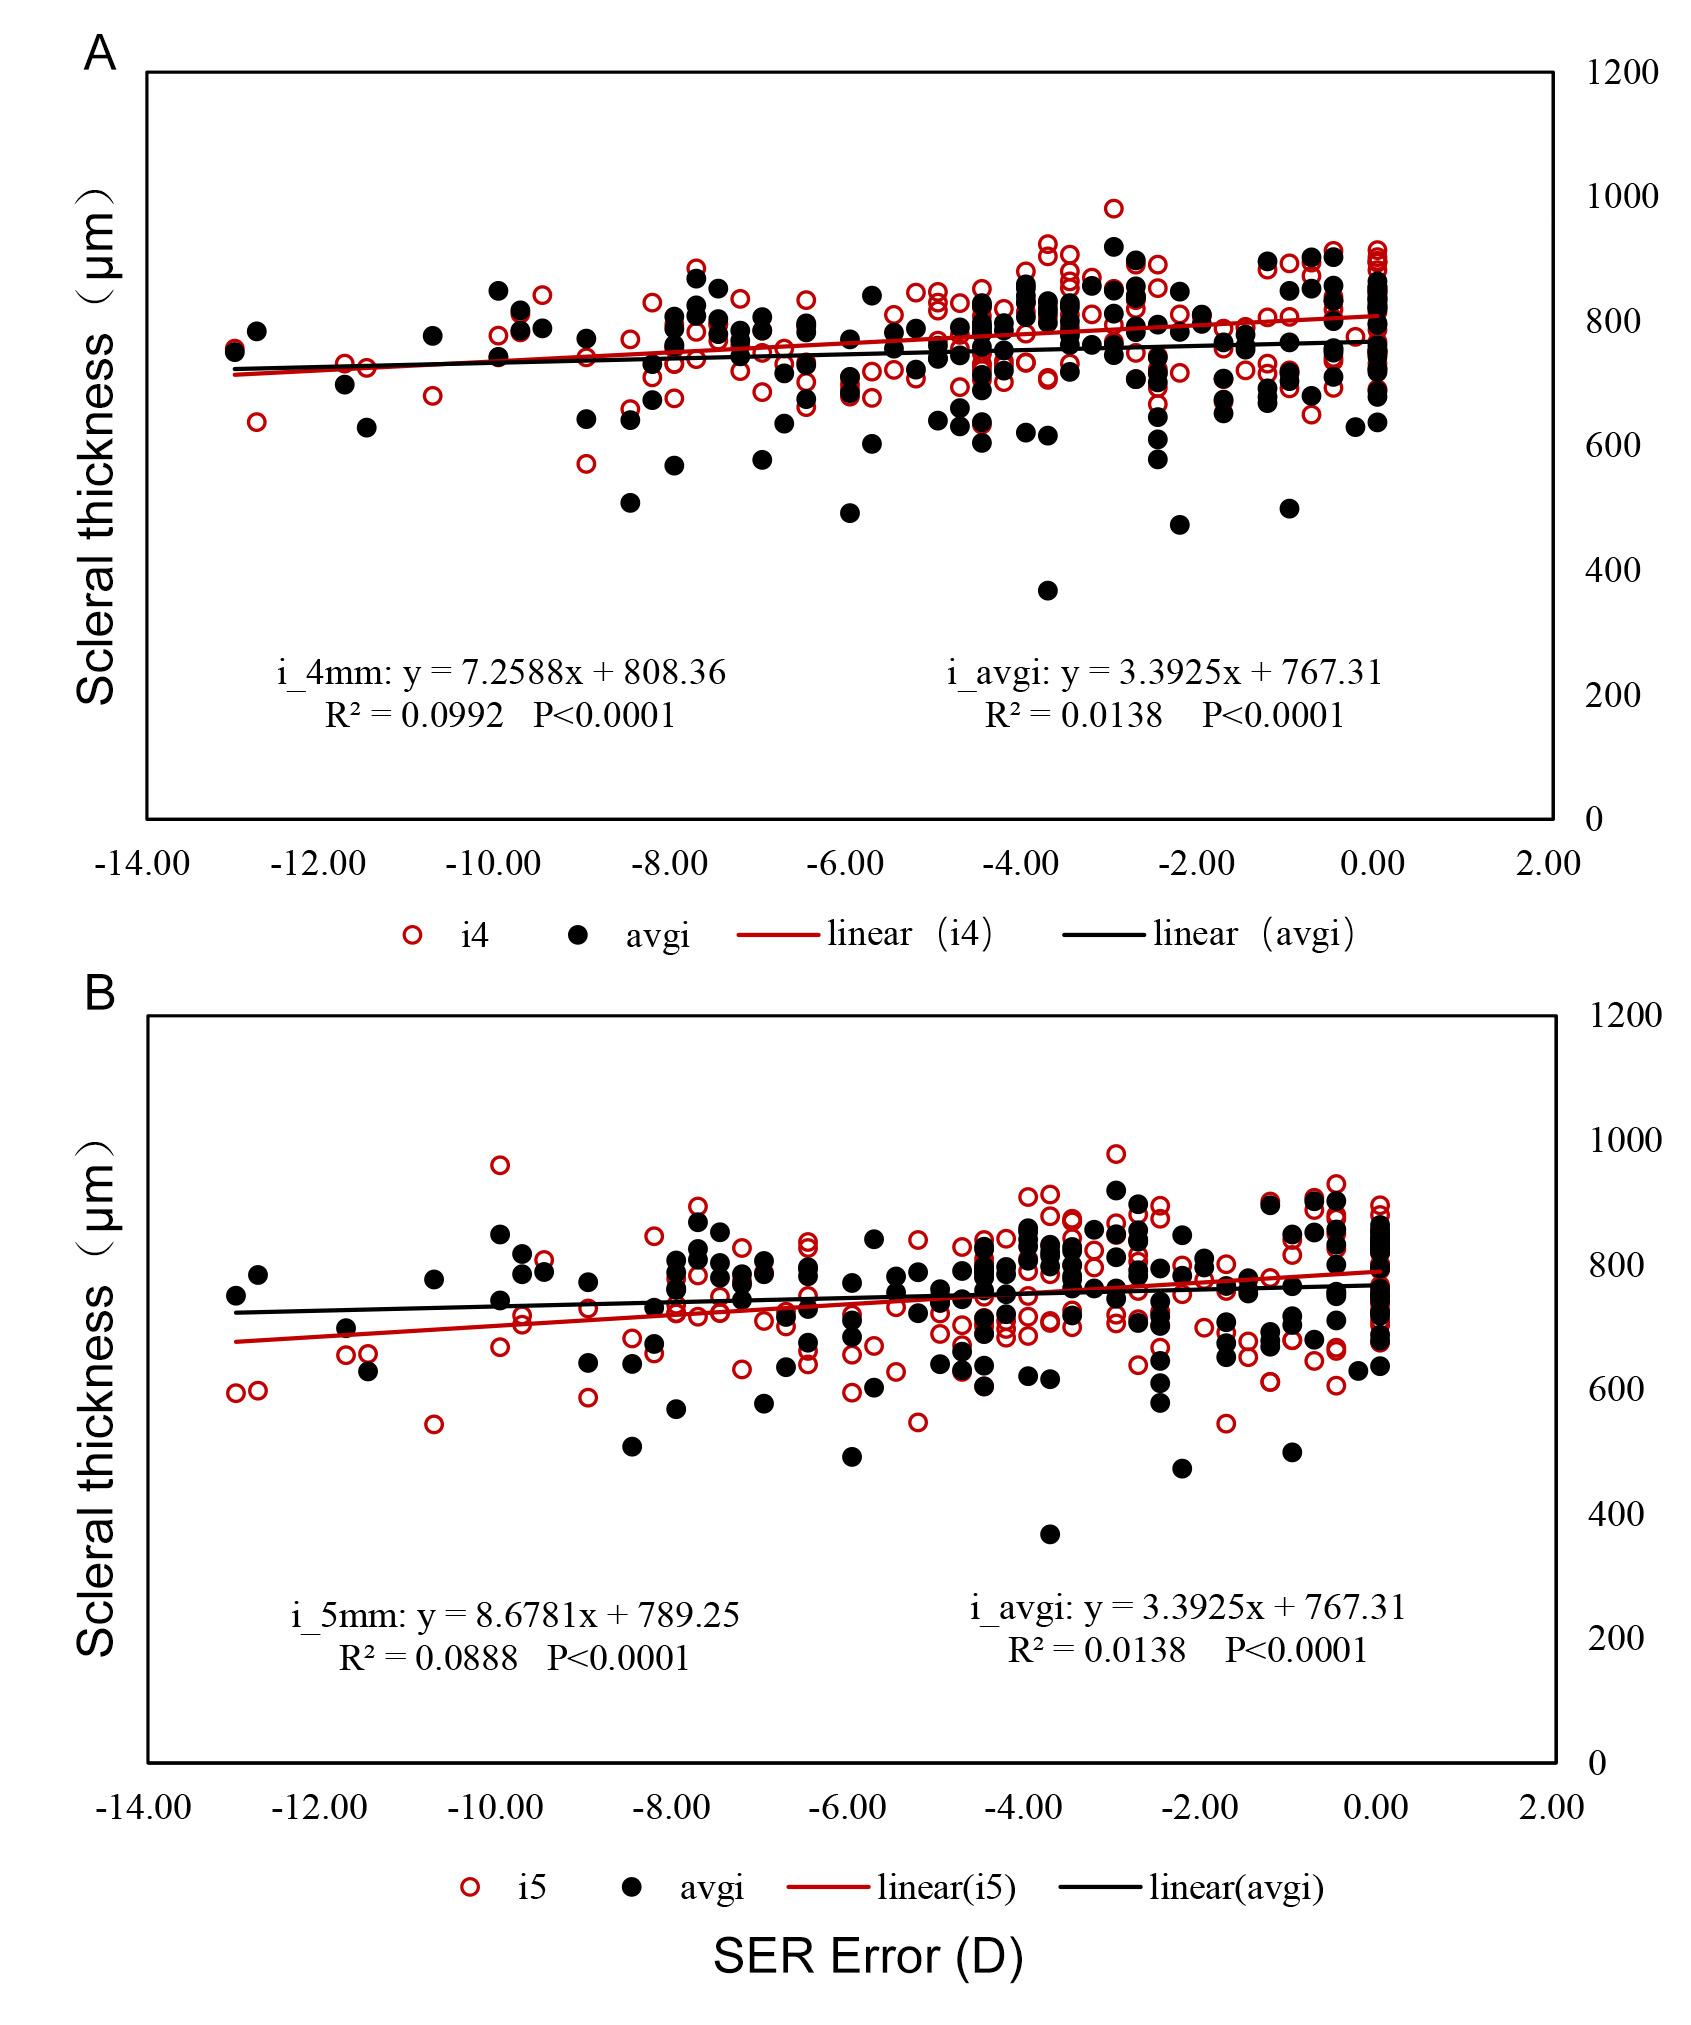
Figure 4. Scatterplots illustrating the relationship between AST and SER errors in the inferior meridian. A: Linear regression between the SER error with the AST at the 4-mm location (red empty circle) and averaged peripheral AST
(black-filled circles). B: Linear regression between an SER error with the AST at the 5-mm location (red empty circle) and averaged peripheral AST
(black-filled circles). The linear regression equation results of AST at the 4-mm and 5-mm locations are displayed in the
graph. Each scatterplot contained 170 image data from 170 patients.

 Figure 4 of
Li, Mol Vis 2024; 30:229-238.
  Figure 4 of
Li, Mol Vis 2024; 30:229-238.