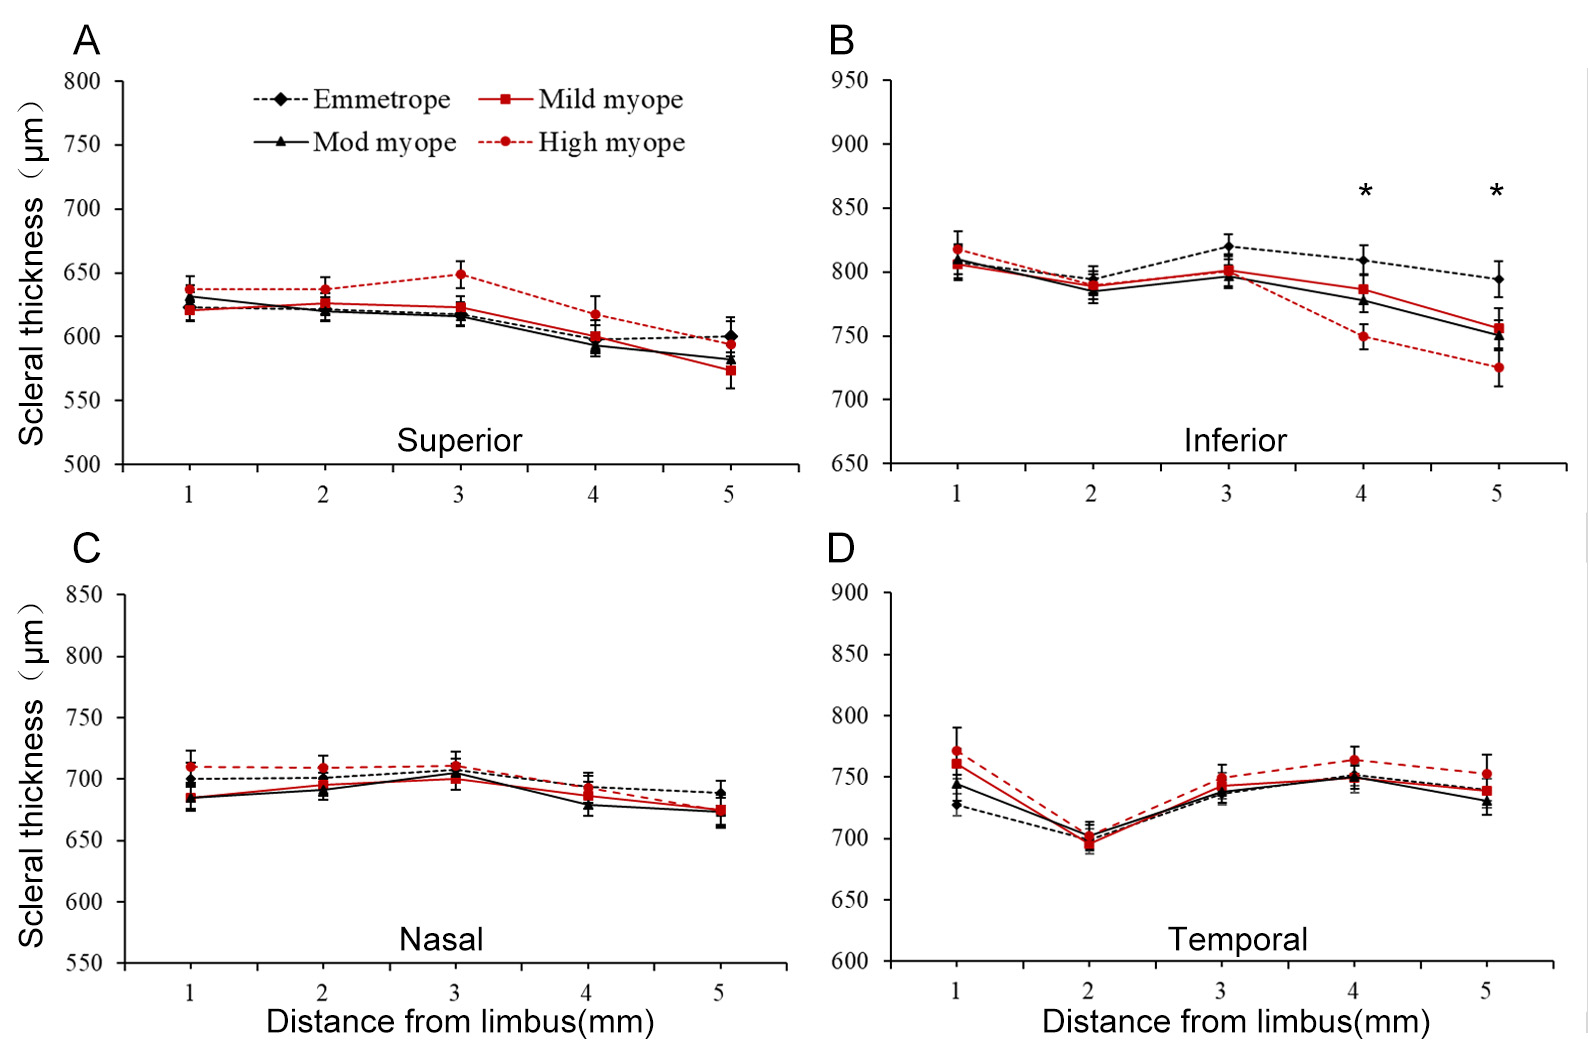
Figure 3. AST with SER errors along four meridians (superior, inferior, nasal, and temporal). “1” indicates the scleral spur to the
1-mm location. “*” represents statistical significance in SER errors. At i4, the mean scleral thickness in the orthopedic
group was higher than in the severe myopia group (p = 0.006, adjusted by DUNNETT), and the same trend was observed at i5 (p
= 0.0031, adjusted by DUNNETT).

 Figure 3 of
Li, Mol Vis 2024; 30:229-238.
  Figure 3 of
Li, Mol Vis 2024; 30:229-238.