Figure 6. RPE and choroidal thickness. A: Representative OCT image of normal CMs (No. 7). B: Representative OCT image of WD CMs (No. 19). The red line represents the RPE, while the blue line indicates the measurement
site for RPE thickness. C–F: Graphs showing the mean RPE thickness. (C, E) CMs. D, F: RMs. *p < 0.05, **p < 0.01 versus normal (CM: normal: n = 30, WD: n = 26; RM: normal: n = 28, WD: n = 22, Student’s t-test) in C and D. **p < 0.01 versus young normal (CM: young: n = 16, adult: n = 14; RM: young: n = 18, adult: n = 10, Student’s t-test) in E and F. WD: WD in macula, young: under 10 years old, adult: 10 years old or more, n: number of eyes. G, H: Correlation diagrams between the number of hyperreflective granules and RPE thickness for CMs and RMs. I, J: Correlation diagrams between the number of hyperreflective granules and choroidal thickness for CMs and RMs. A positive
correlation is suggested between the number of hyperreflective granules and RPE thickness in CM (n = 56, r = 0.6747, p = 1.17932E-08,
Pearson correlation coefficient) in G and in RM (n = 50, r = 0.6344, p = 7.52089E-07, Pearson correlation coefficient) in H. Only a weak correlation is observed between I and J. Scale bars: 200 μm in A, B.
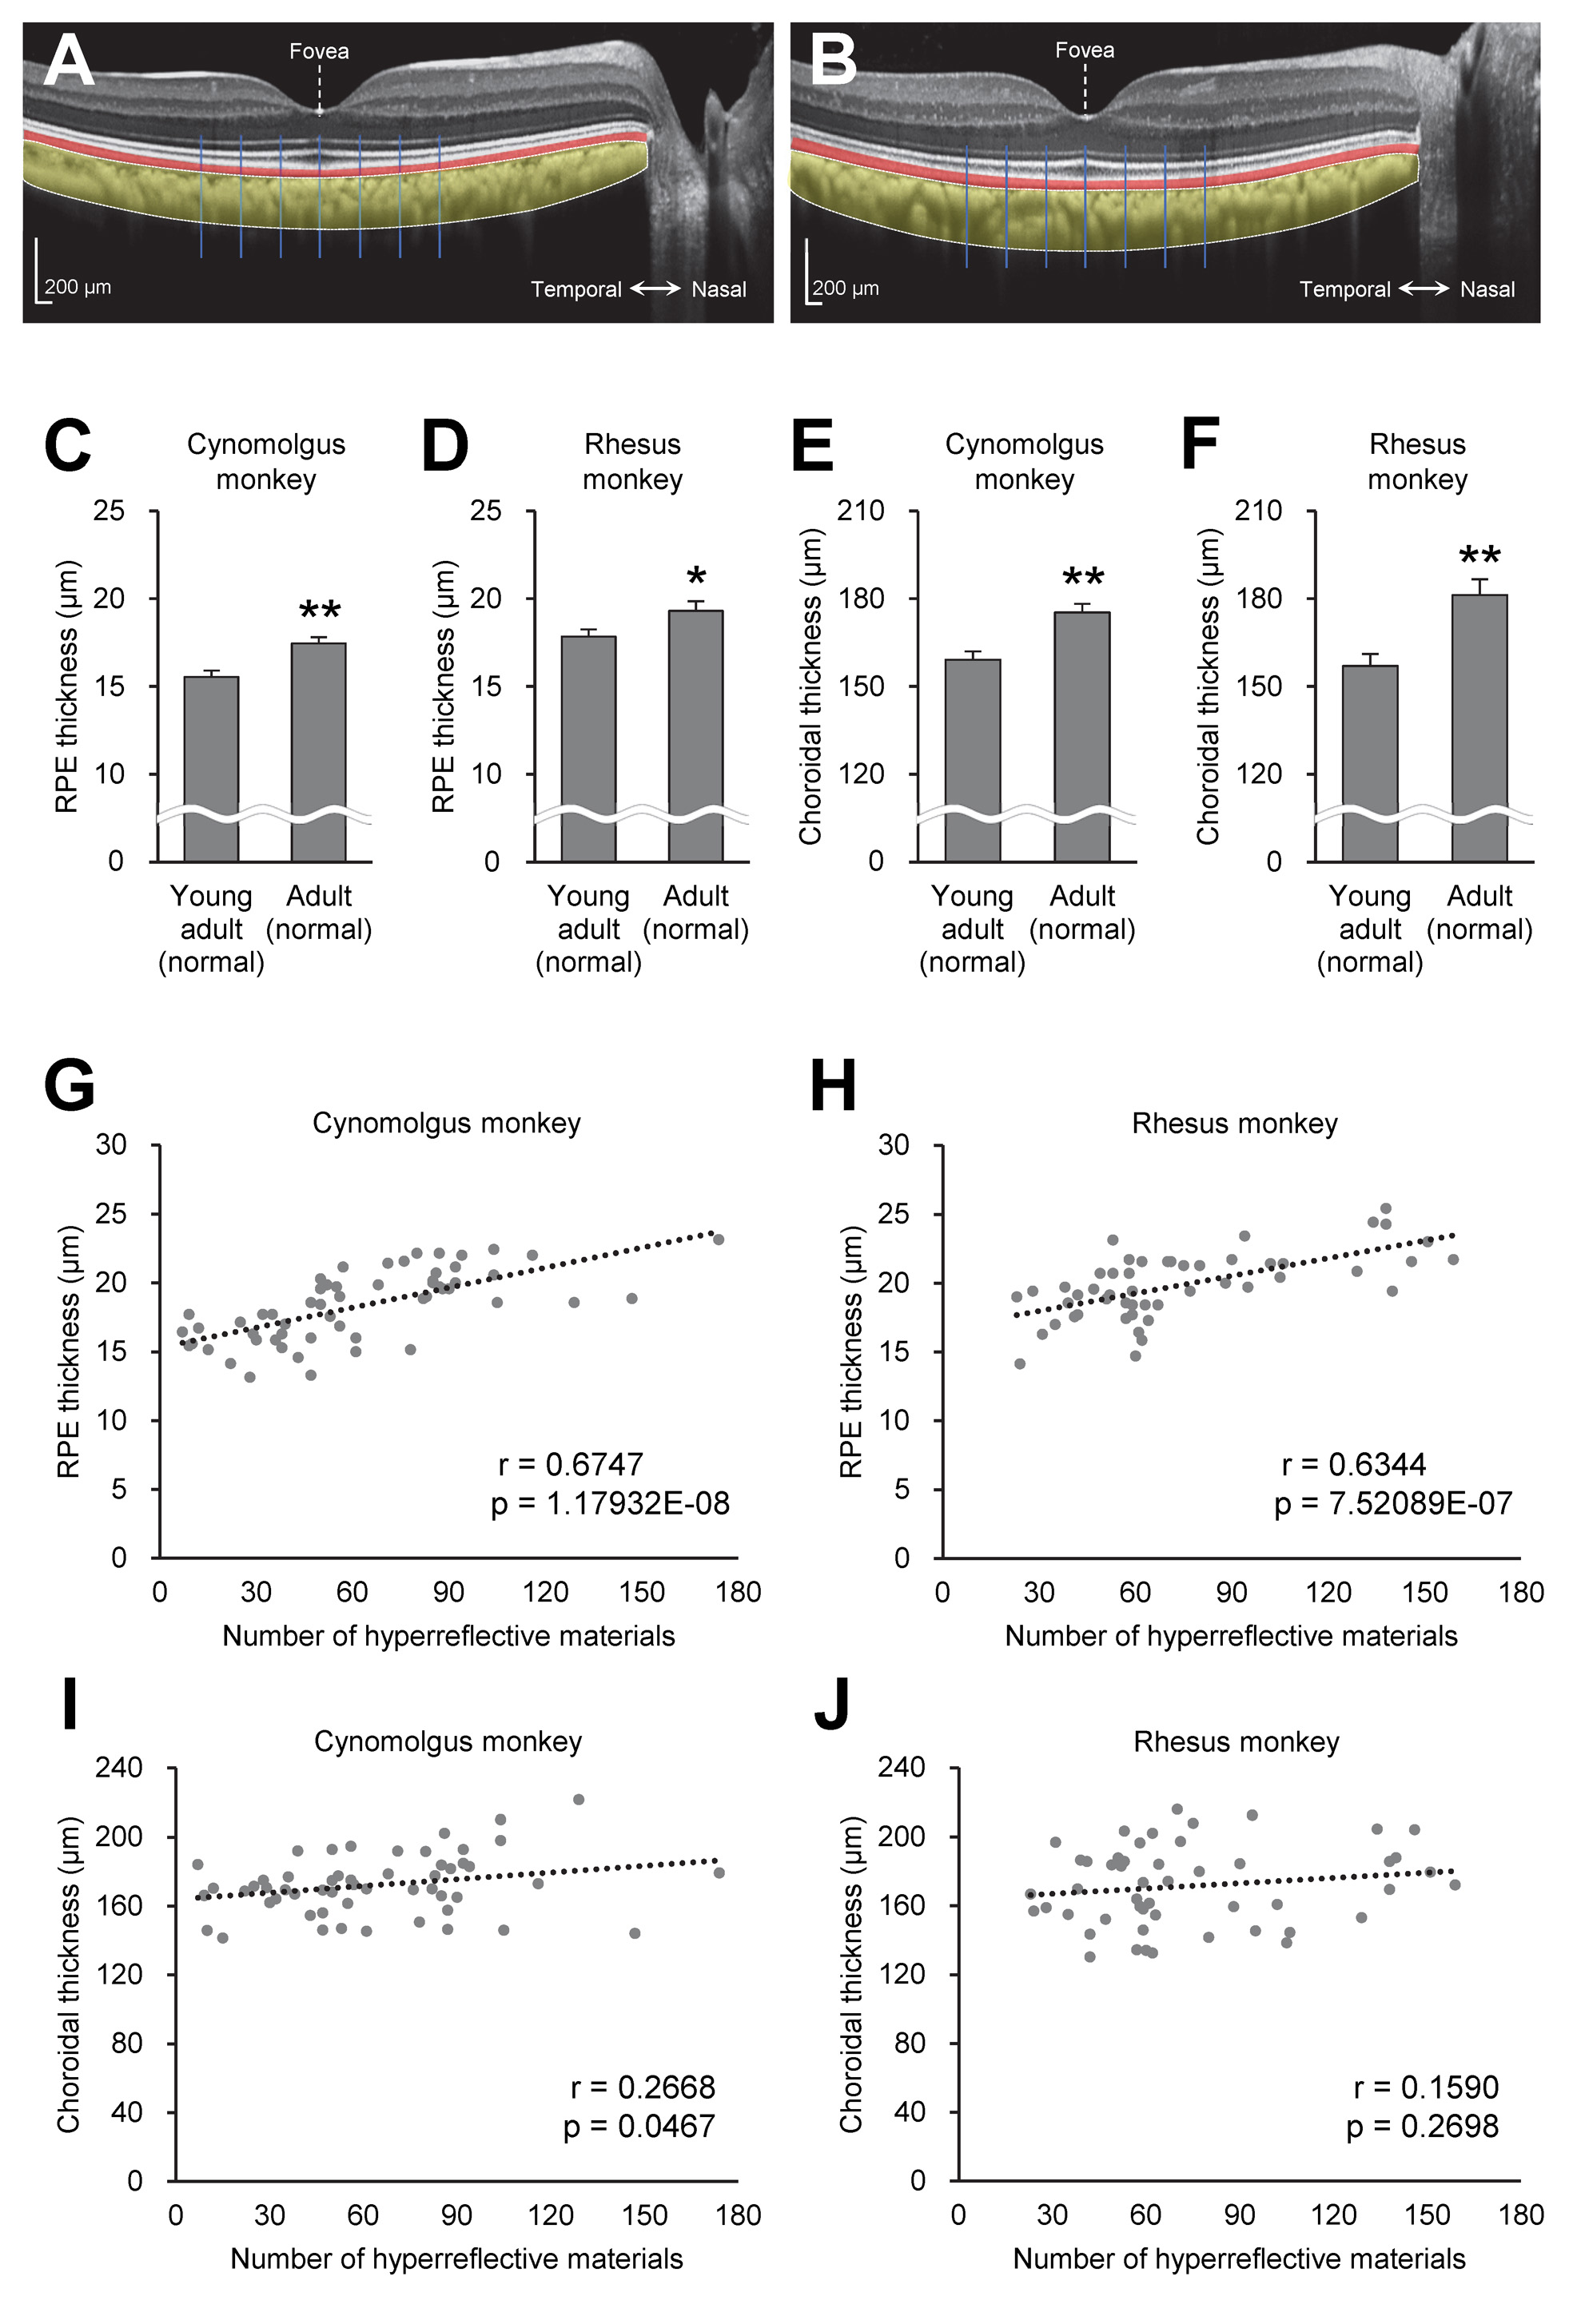
 Figure 6 of
Araki, Mol Vis 2024; 30:219-233.
Figure 6 of
Araki, Mol Vis 2024; 30:219-233.