Figure 5. Hyperreflective granules between the EZ and RPE in the macula of OCT images. A: Representative OCT image of normal CMs (No. 7). B: Representative OCT image of WD CMs (No. 19). C, D: Enlarged image of the red frame. Hyperreflective granules (arrowheads) can be seen between the EZ and RPE at the macula.
E, F: Graphs showing the total number of hyperreflective granules in the OCT image. Hyperreflective granules are even found in
normal animals, but a significantly larger quantity is seen in animals with WDs in fundus examinations. **p < 0.01 versus normal (CM: normal: n = 30, WD: n = 26; RM: normal: n = 28, WD: n = 22; Student’s t-test). WD: WD in macula, n: number of eyes. G, H: Correlation diagrams between the number of hyperreflective granules and the number of WDs for CMs and RMs. A positive correlation
is suggested between the number of hyperreflective granules and RPE thickness in CM (n = 56, ρ = 0.6868, p = 5.07595E-09,
Spearman’s rank correlation coefficient) in G and in RM (n = 50, ρ = 0.6764, p = 6.03283E-06, Spearman’s rank correlation coefficient) in H. Scale bars: 100 μm in A, B; 50 μm in C, D.
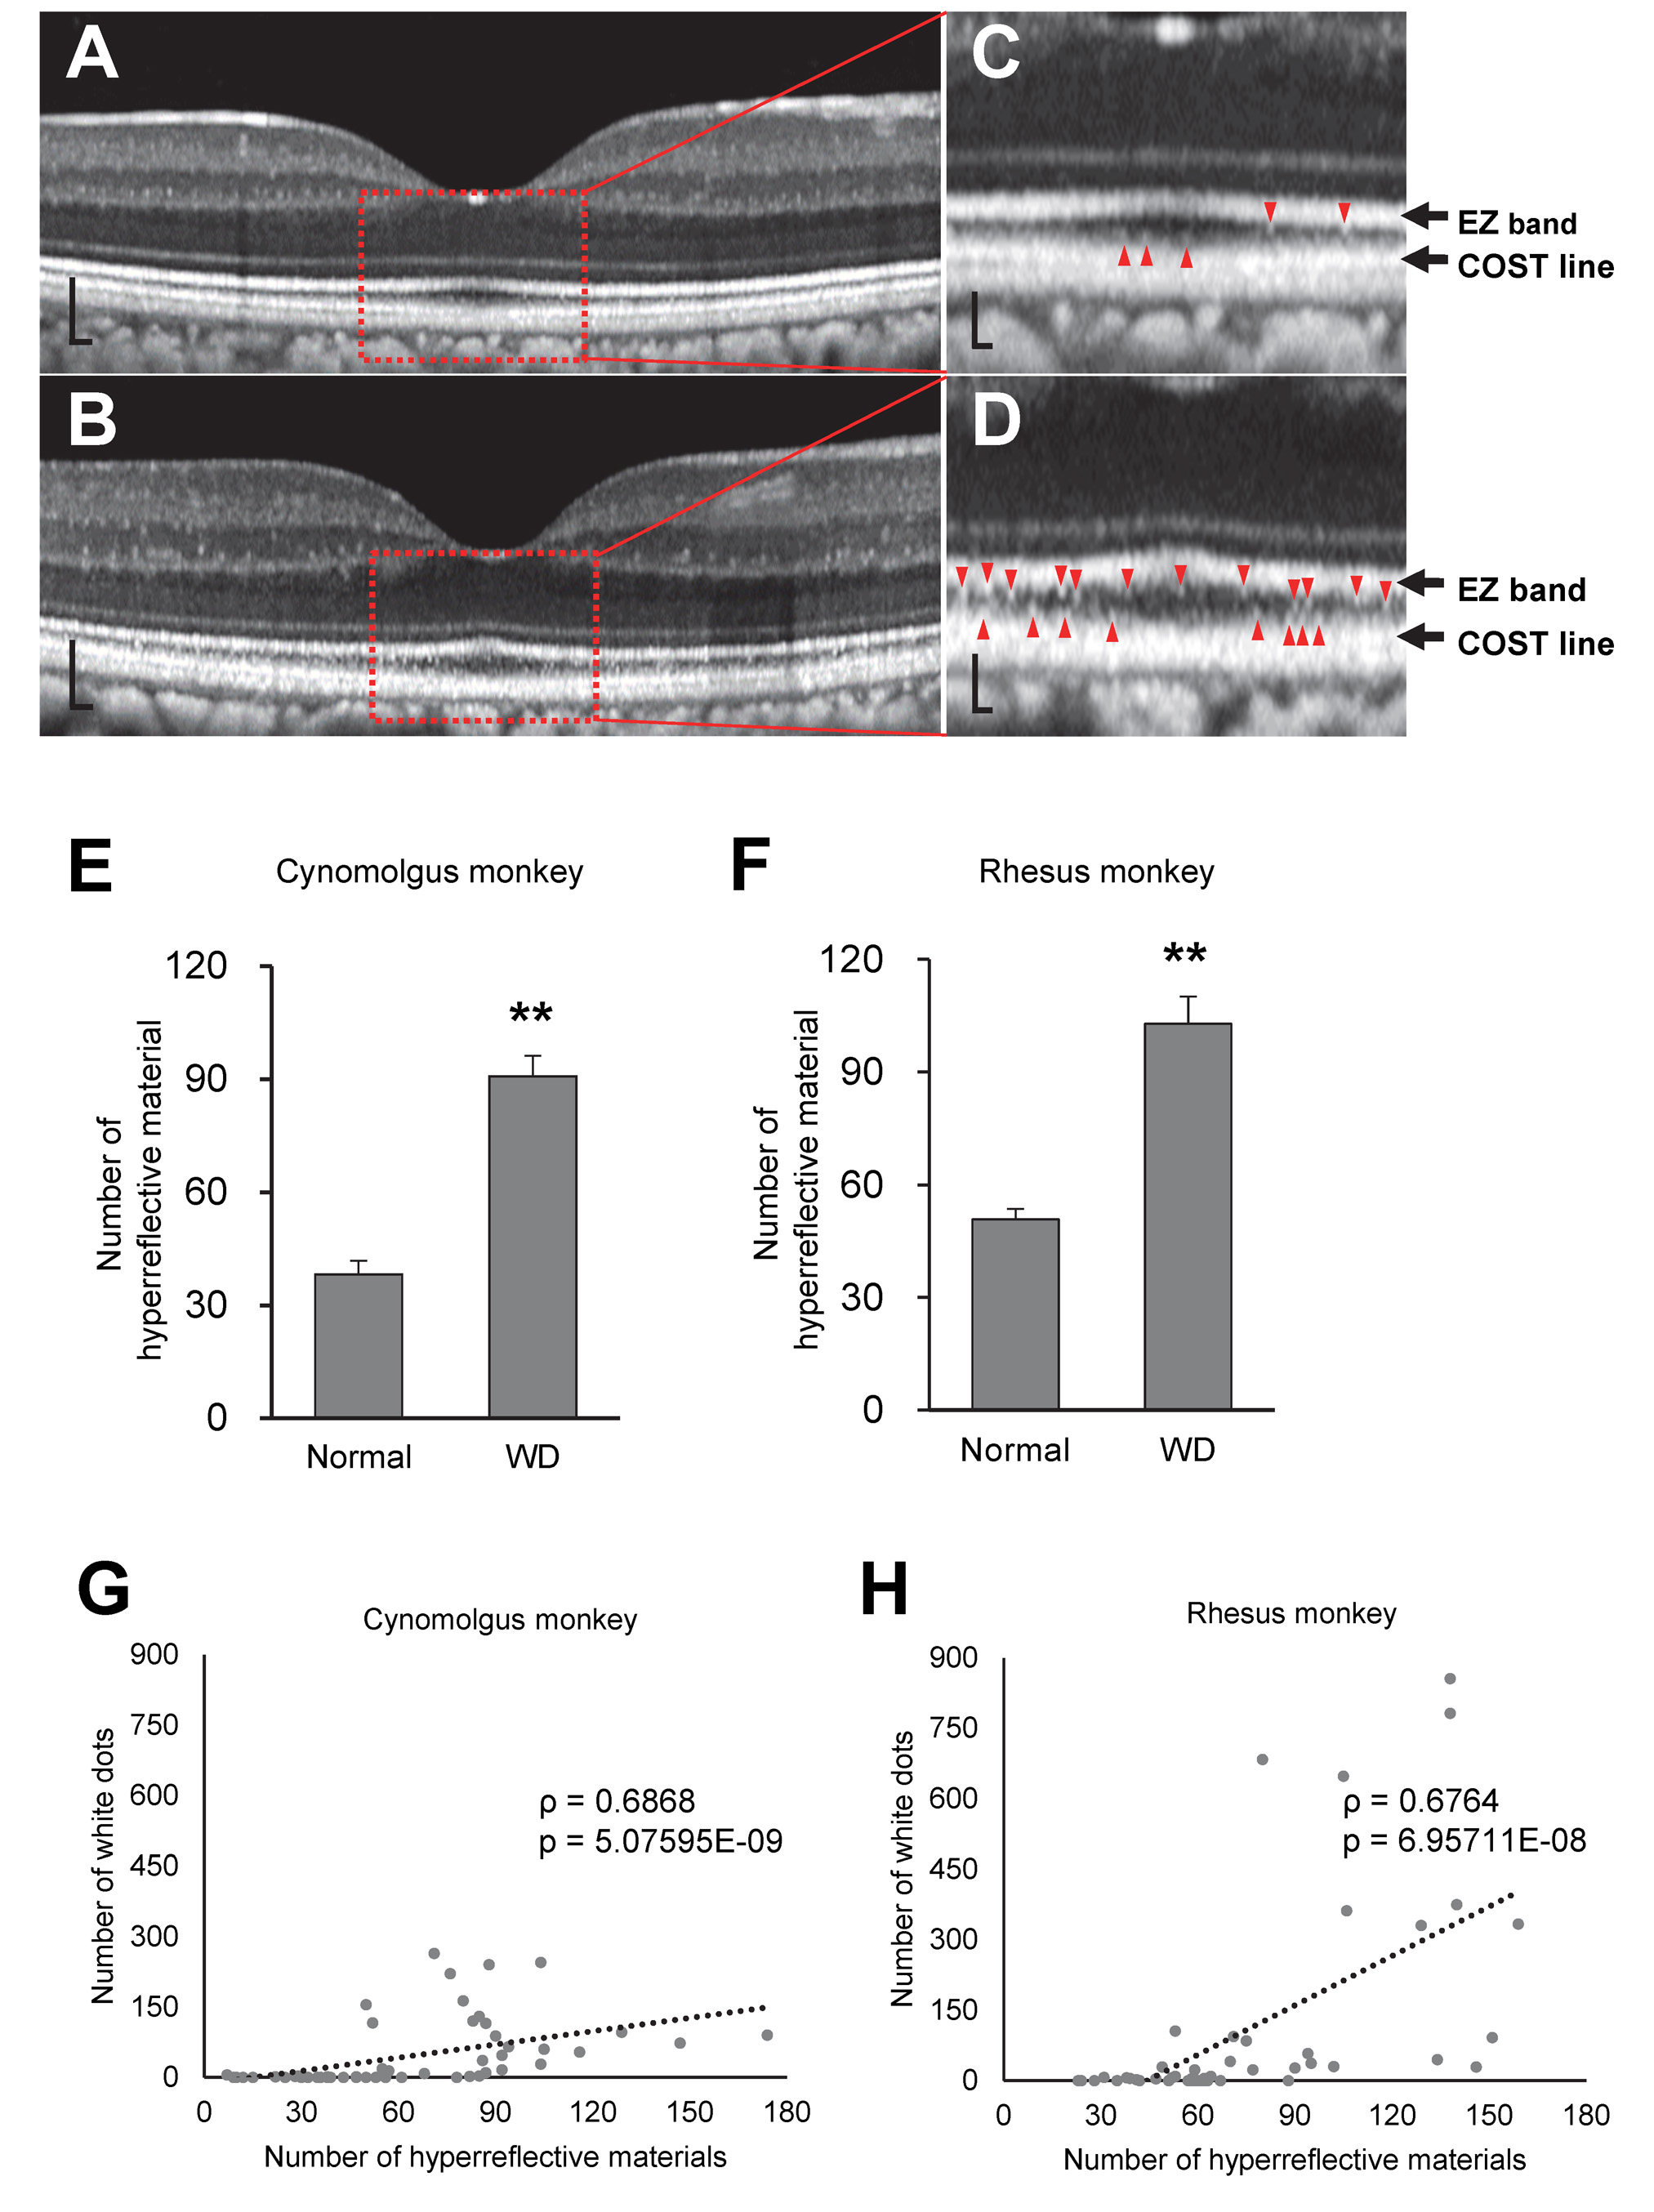
 Figure 5 of
Araki, Mol Vis 2024; 30:219-233.
Figure 5 of
Araki, Mol Vis 2024; 30:219-233.