Figure 3. Graphical representation of WD distribution across the nine defined regions. A, B: Percentage of animals with WDs in each of the nine regions. C, D: Average count of WDs in each region for the animals studied. CM: normal: n = 30, WD: n = 26; RM: normal: n = 28, WD: n =
22, **p < 0.01 versus No. 5 (Student’s t-test). WD: WD in macula; n: number of eyes.
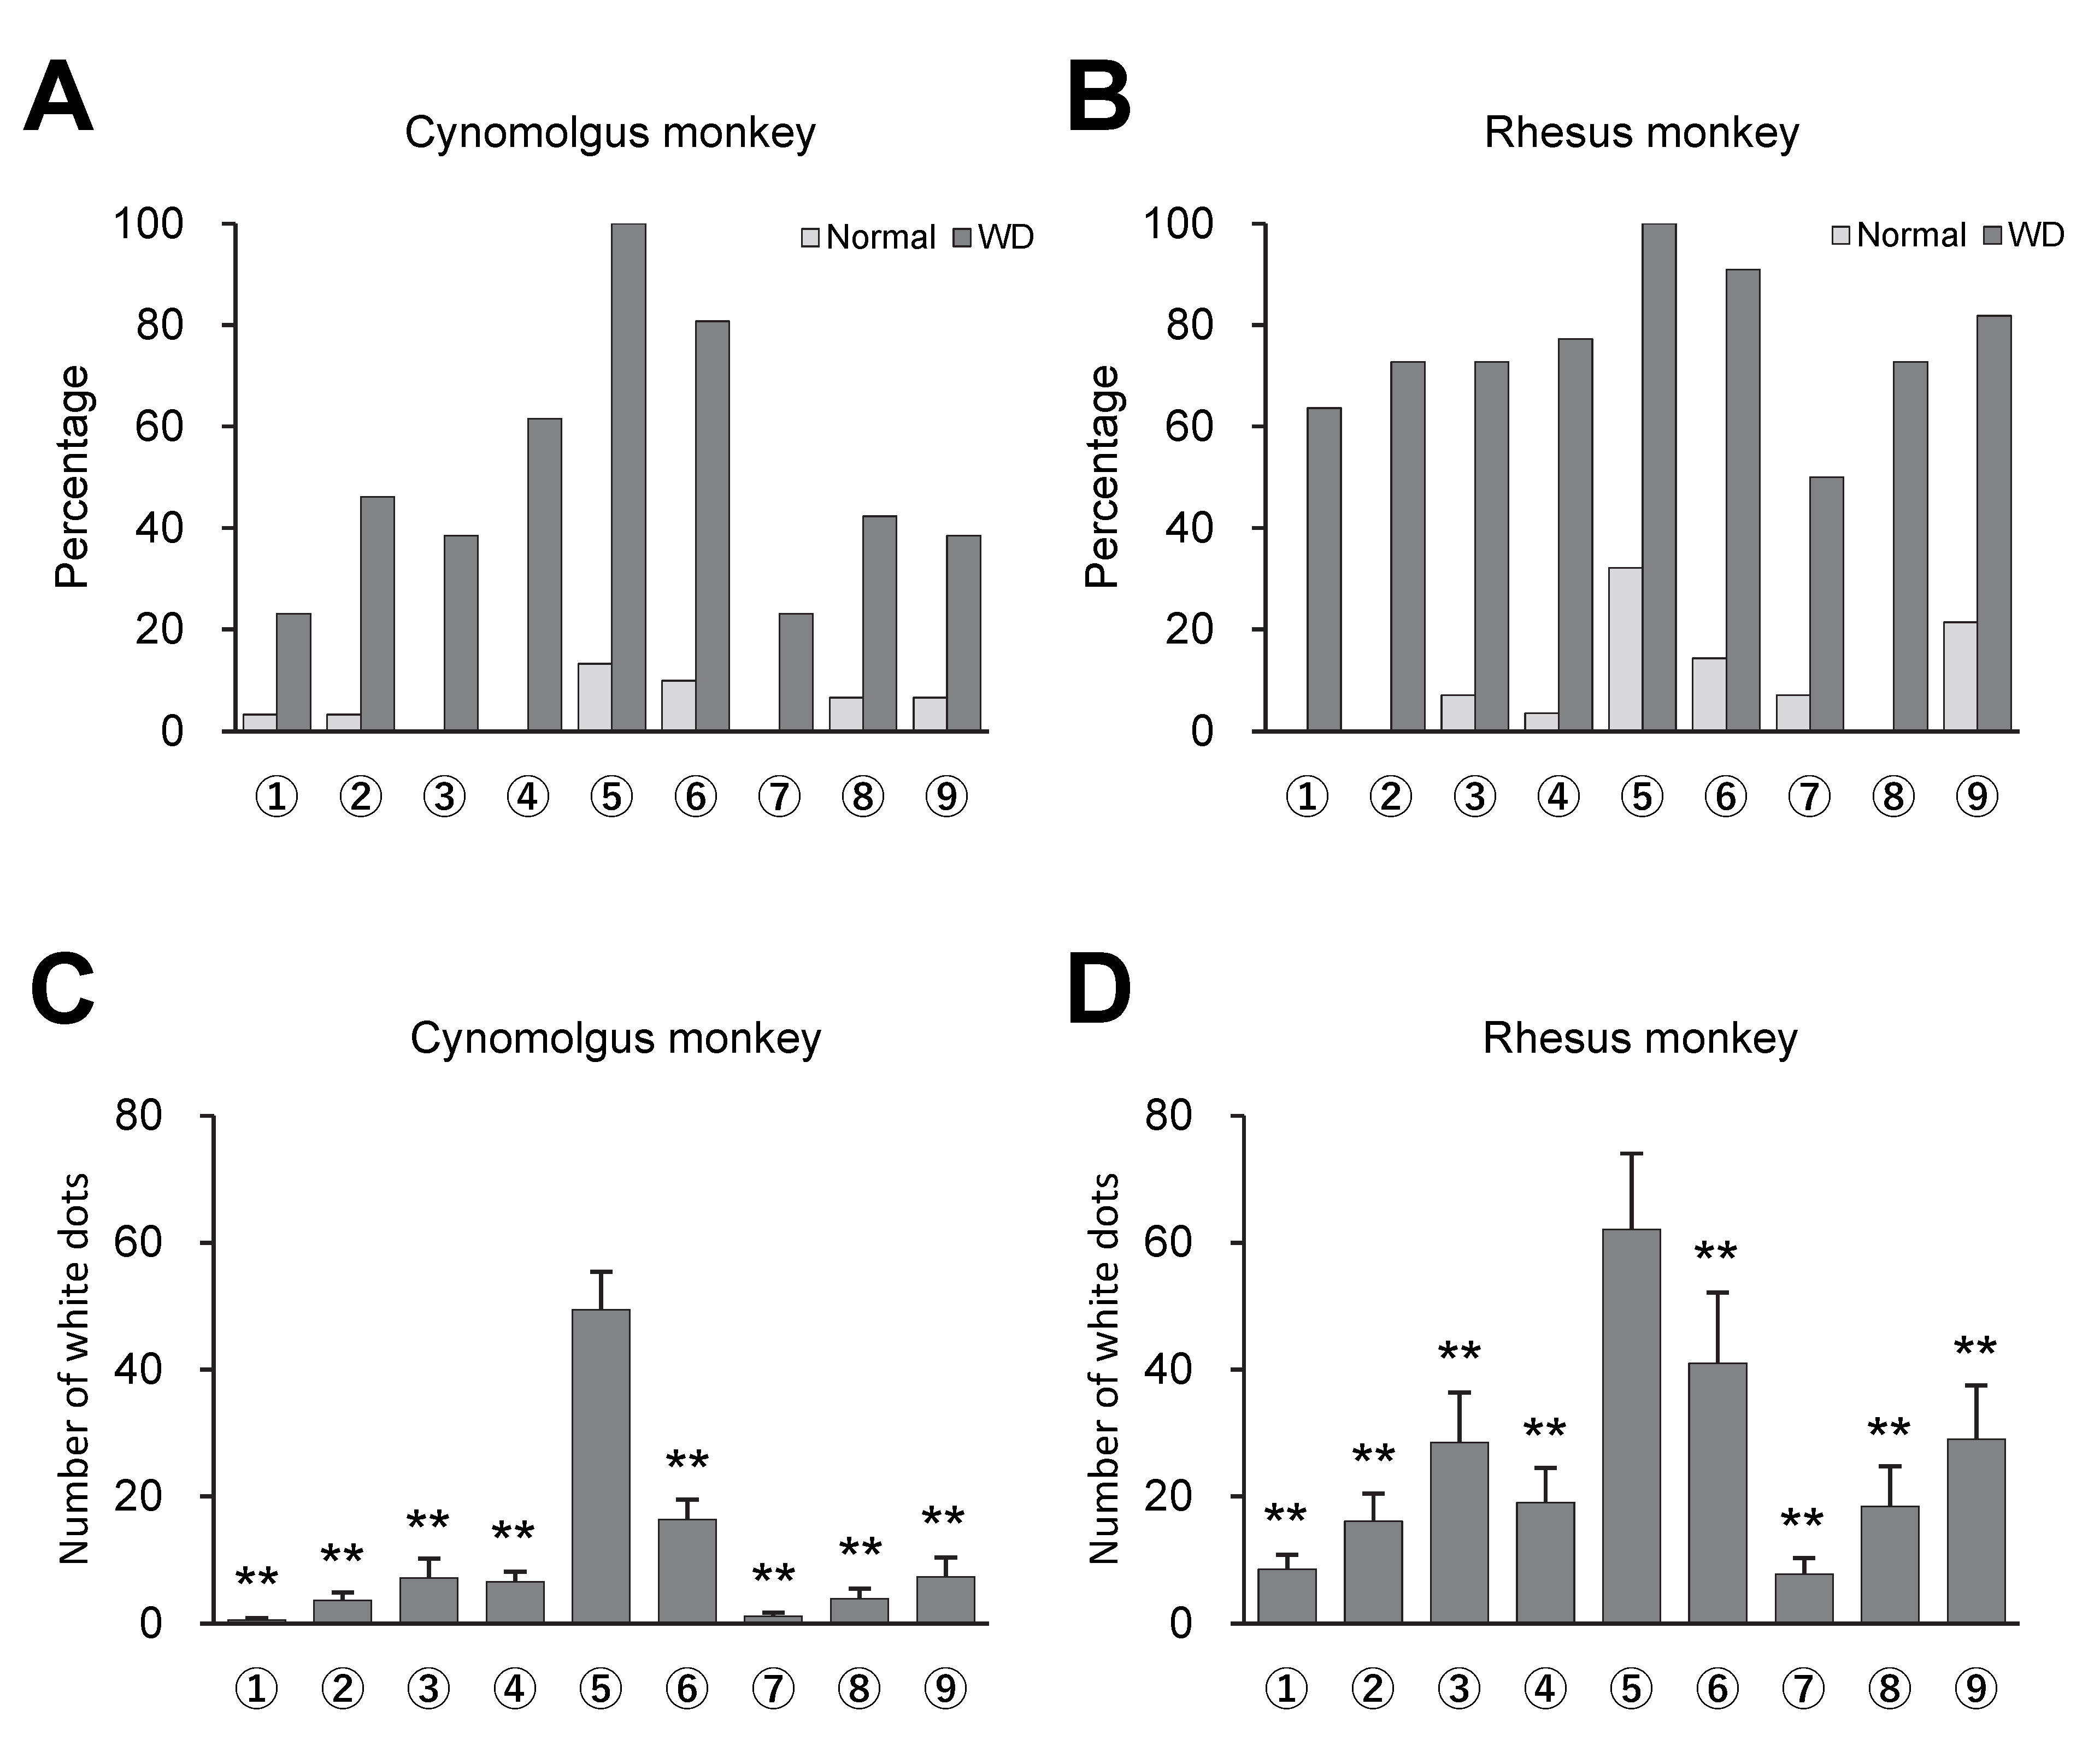
 Figure 3 of
Araki, Mol Vis 2024; 30:219-233.
Figure 3 of
Araki, Mol Vis 2024; 30:219-233.