Figure 1. Fundus images illustrating measurement sites for WD distribution and assessment regions for counting hyperreflective granules
in OCT. A: Right eye showing sites for WD distribution. B: Left eye showing sites for WD distribution. C: Assessment regions for counting hyperreflective granules (the image represents the right eye). The numbers of hyperreflective
granules at the measurement sites from a to d are summed. The green line represents the cutting plane of the OCT. Scale bars: 500 μm in A, B; 200 μm in C.
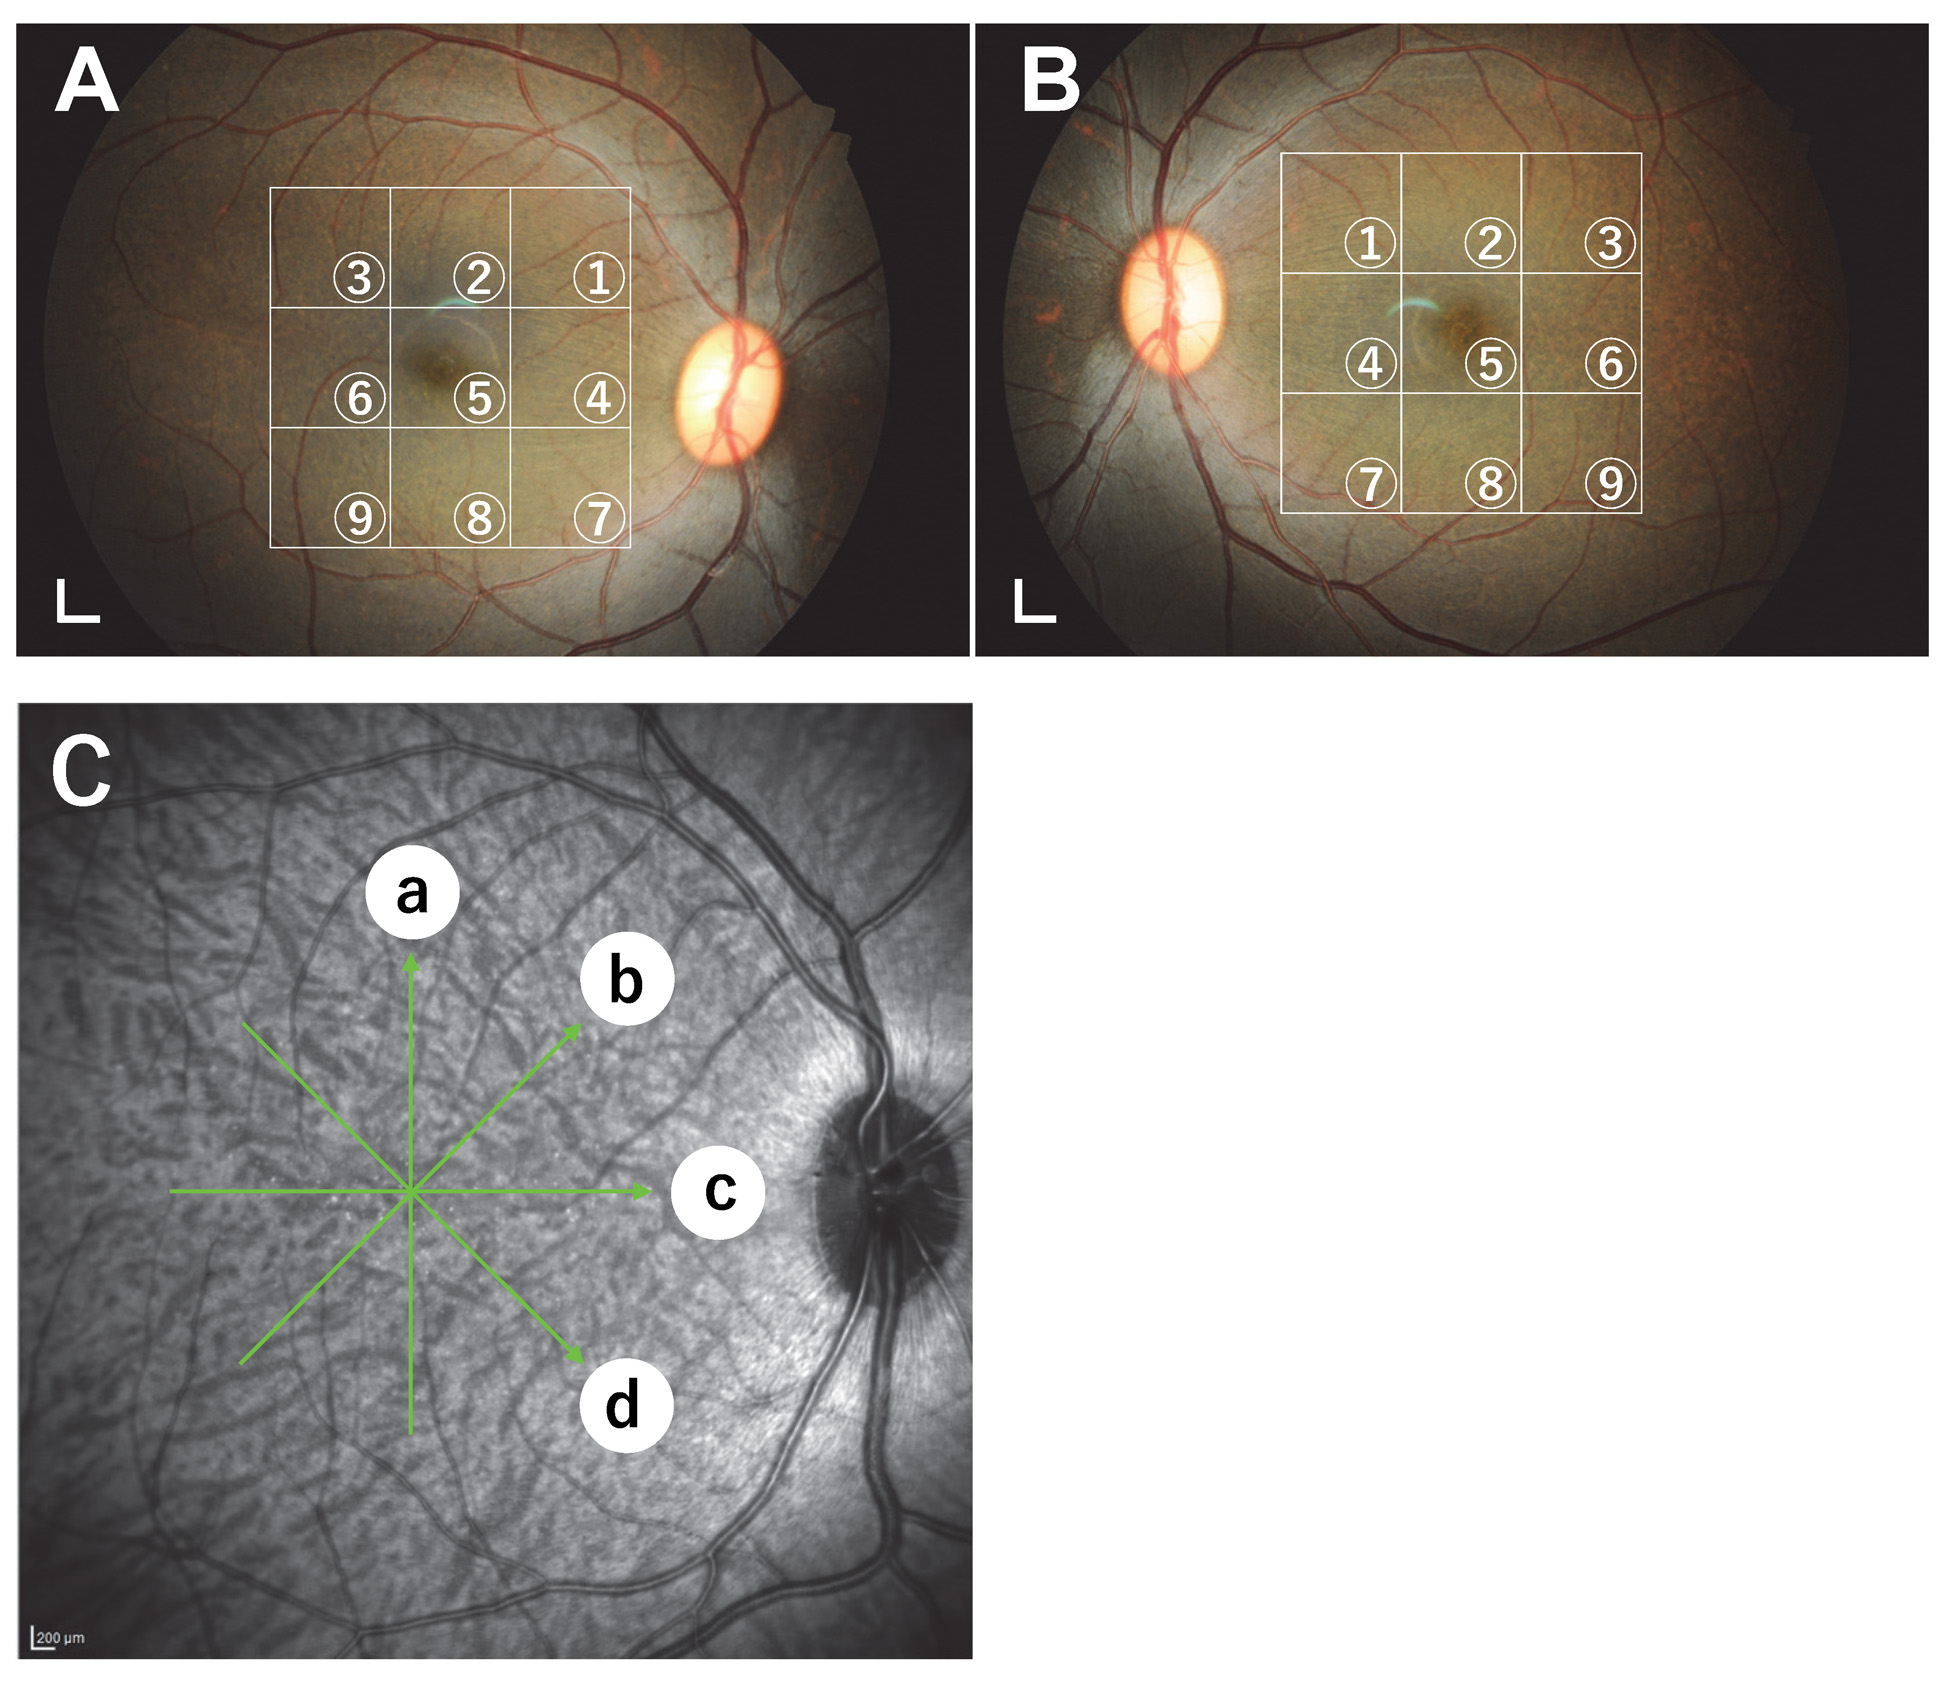
 Figure 1 of
Araki, Mol Vis 2024; 30:219-233.
Figure 1 of
Araki, Mol Vis 2024; 30:219-233.