Figure 3. Effects of SFN on the expression of integrins in HTFs. Representative bar graphs showing the relative expression of integrins
α5, β1 mRNA in differentially treated cells. Data are presented as mean ± SD (n=3). *p<0.05 compared to controls. †p<0.05
compared to cells treated with TGF-β alone.
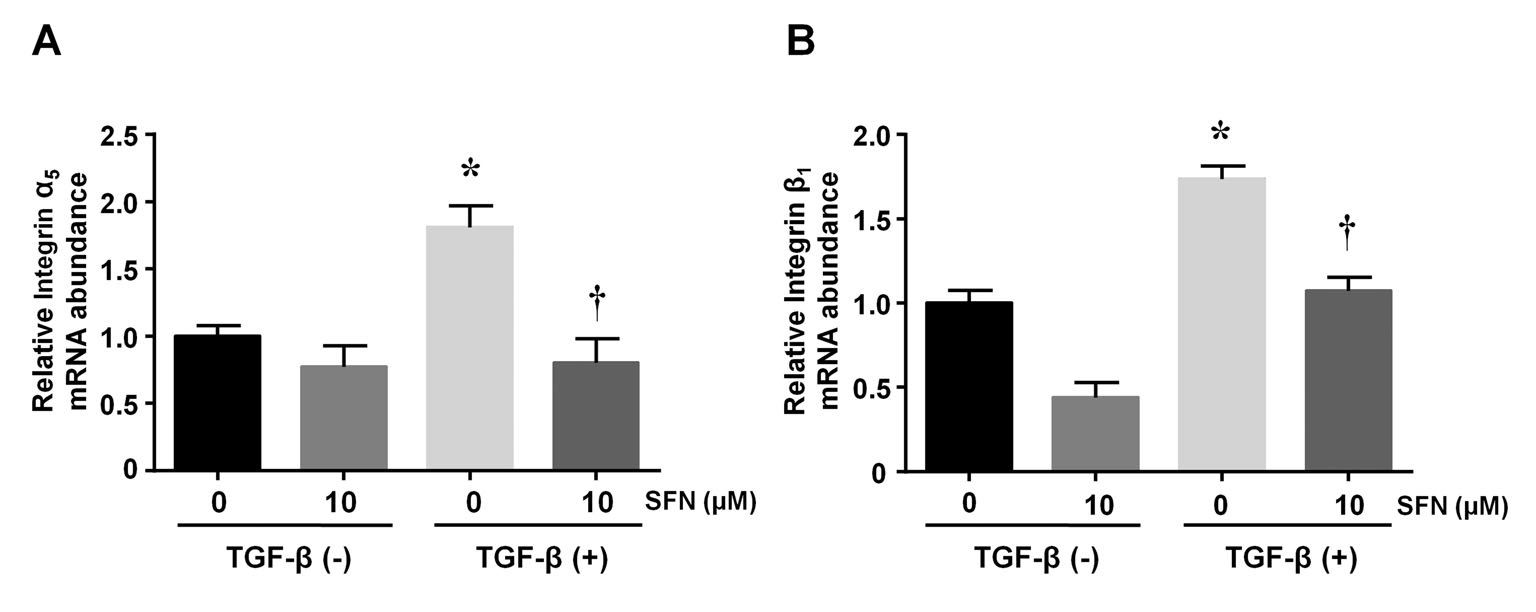
 Figure 3 of
Liu, Mol Vis 2024; 30:200-210.
Figure 3 of
Liu, Mol Vis 2024; 30:200-210.