Figure 2. Effects of SFN on the expression of α-SMA and fibronectin in HTFs. (A) Representative blots showing the expression of α-SMA
and fibronectin. Densitometric analysis of α-SMA and fibronectin proteins normalized to GAPDH levels in (A) is shown in (B).
(C) Representative bar graphs showing the relative expression of α-SMA (left panel) and fibronectin (right panel) mRNAs in
differentially treated cells. Data are presented as mean ± SD (n=3). *p<0.05 compared to controls. †p<0.05 compared to cells
treated with TGF-β alone.
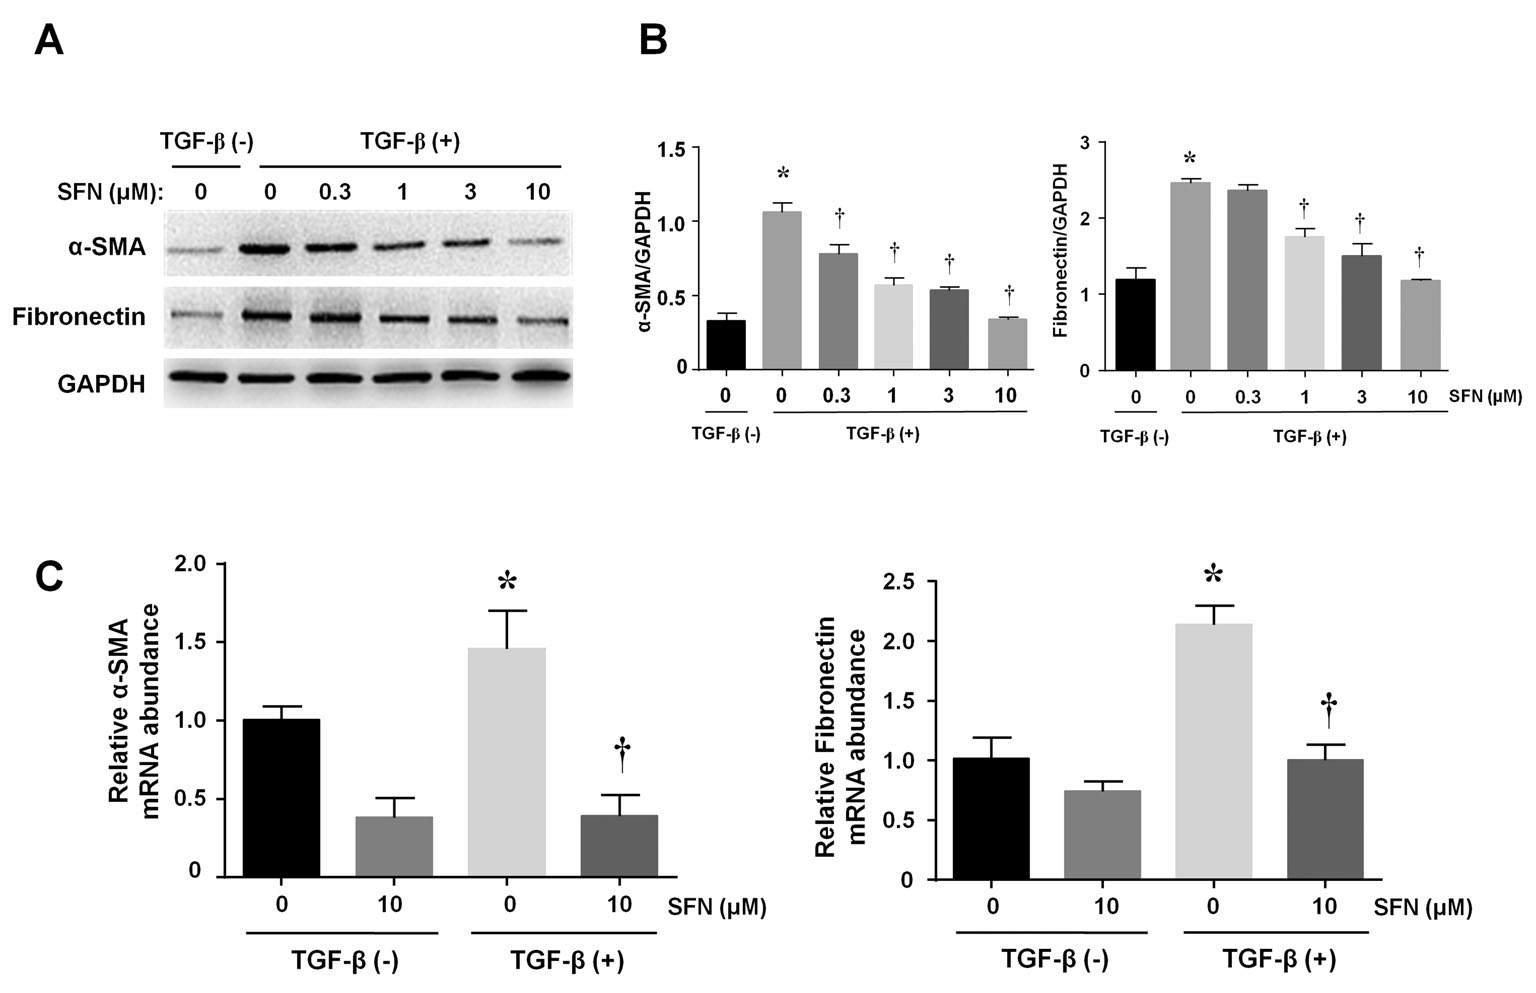
 Figure 2 of
Liu, Mol Vis 2024; 30:200-210.
Figure 2 of
Liu, Mol Vis 2024; 30:200-210.