Figure 6. Correlation plots of protein levels correlated with CST. All data points of the relative abundance of protein levels as determined
by mass spectrometry are plotted against the corresponding CST values of each patient. A best-fit linear regression line with
95% confidence bands (dotted line) is shown. Protein levels are presented as log2-transformed label-free quantification units (LFQ); CST values are log10-transformed. Pearson’s correlation coefficient (r) and p values (P) are given, with p < 0.05 being statistically significant.
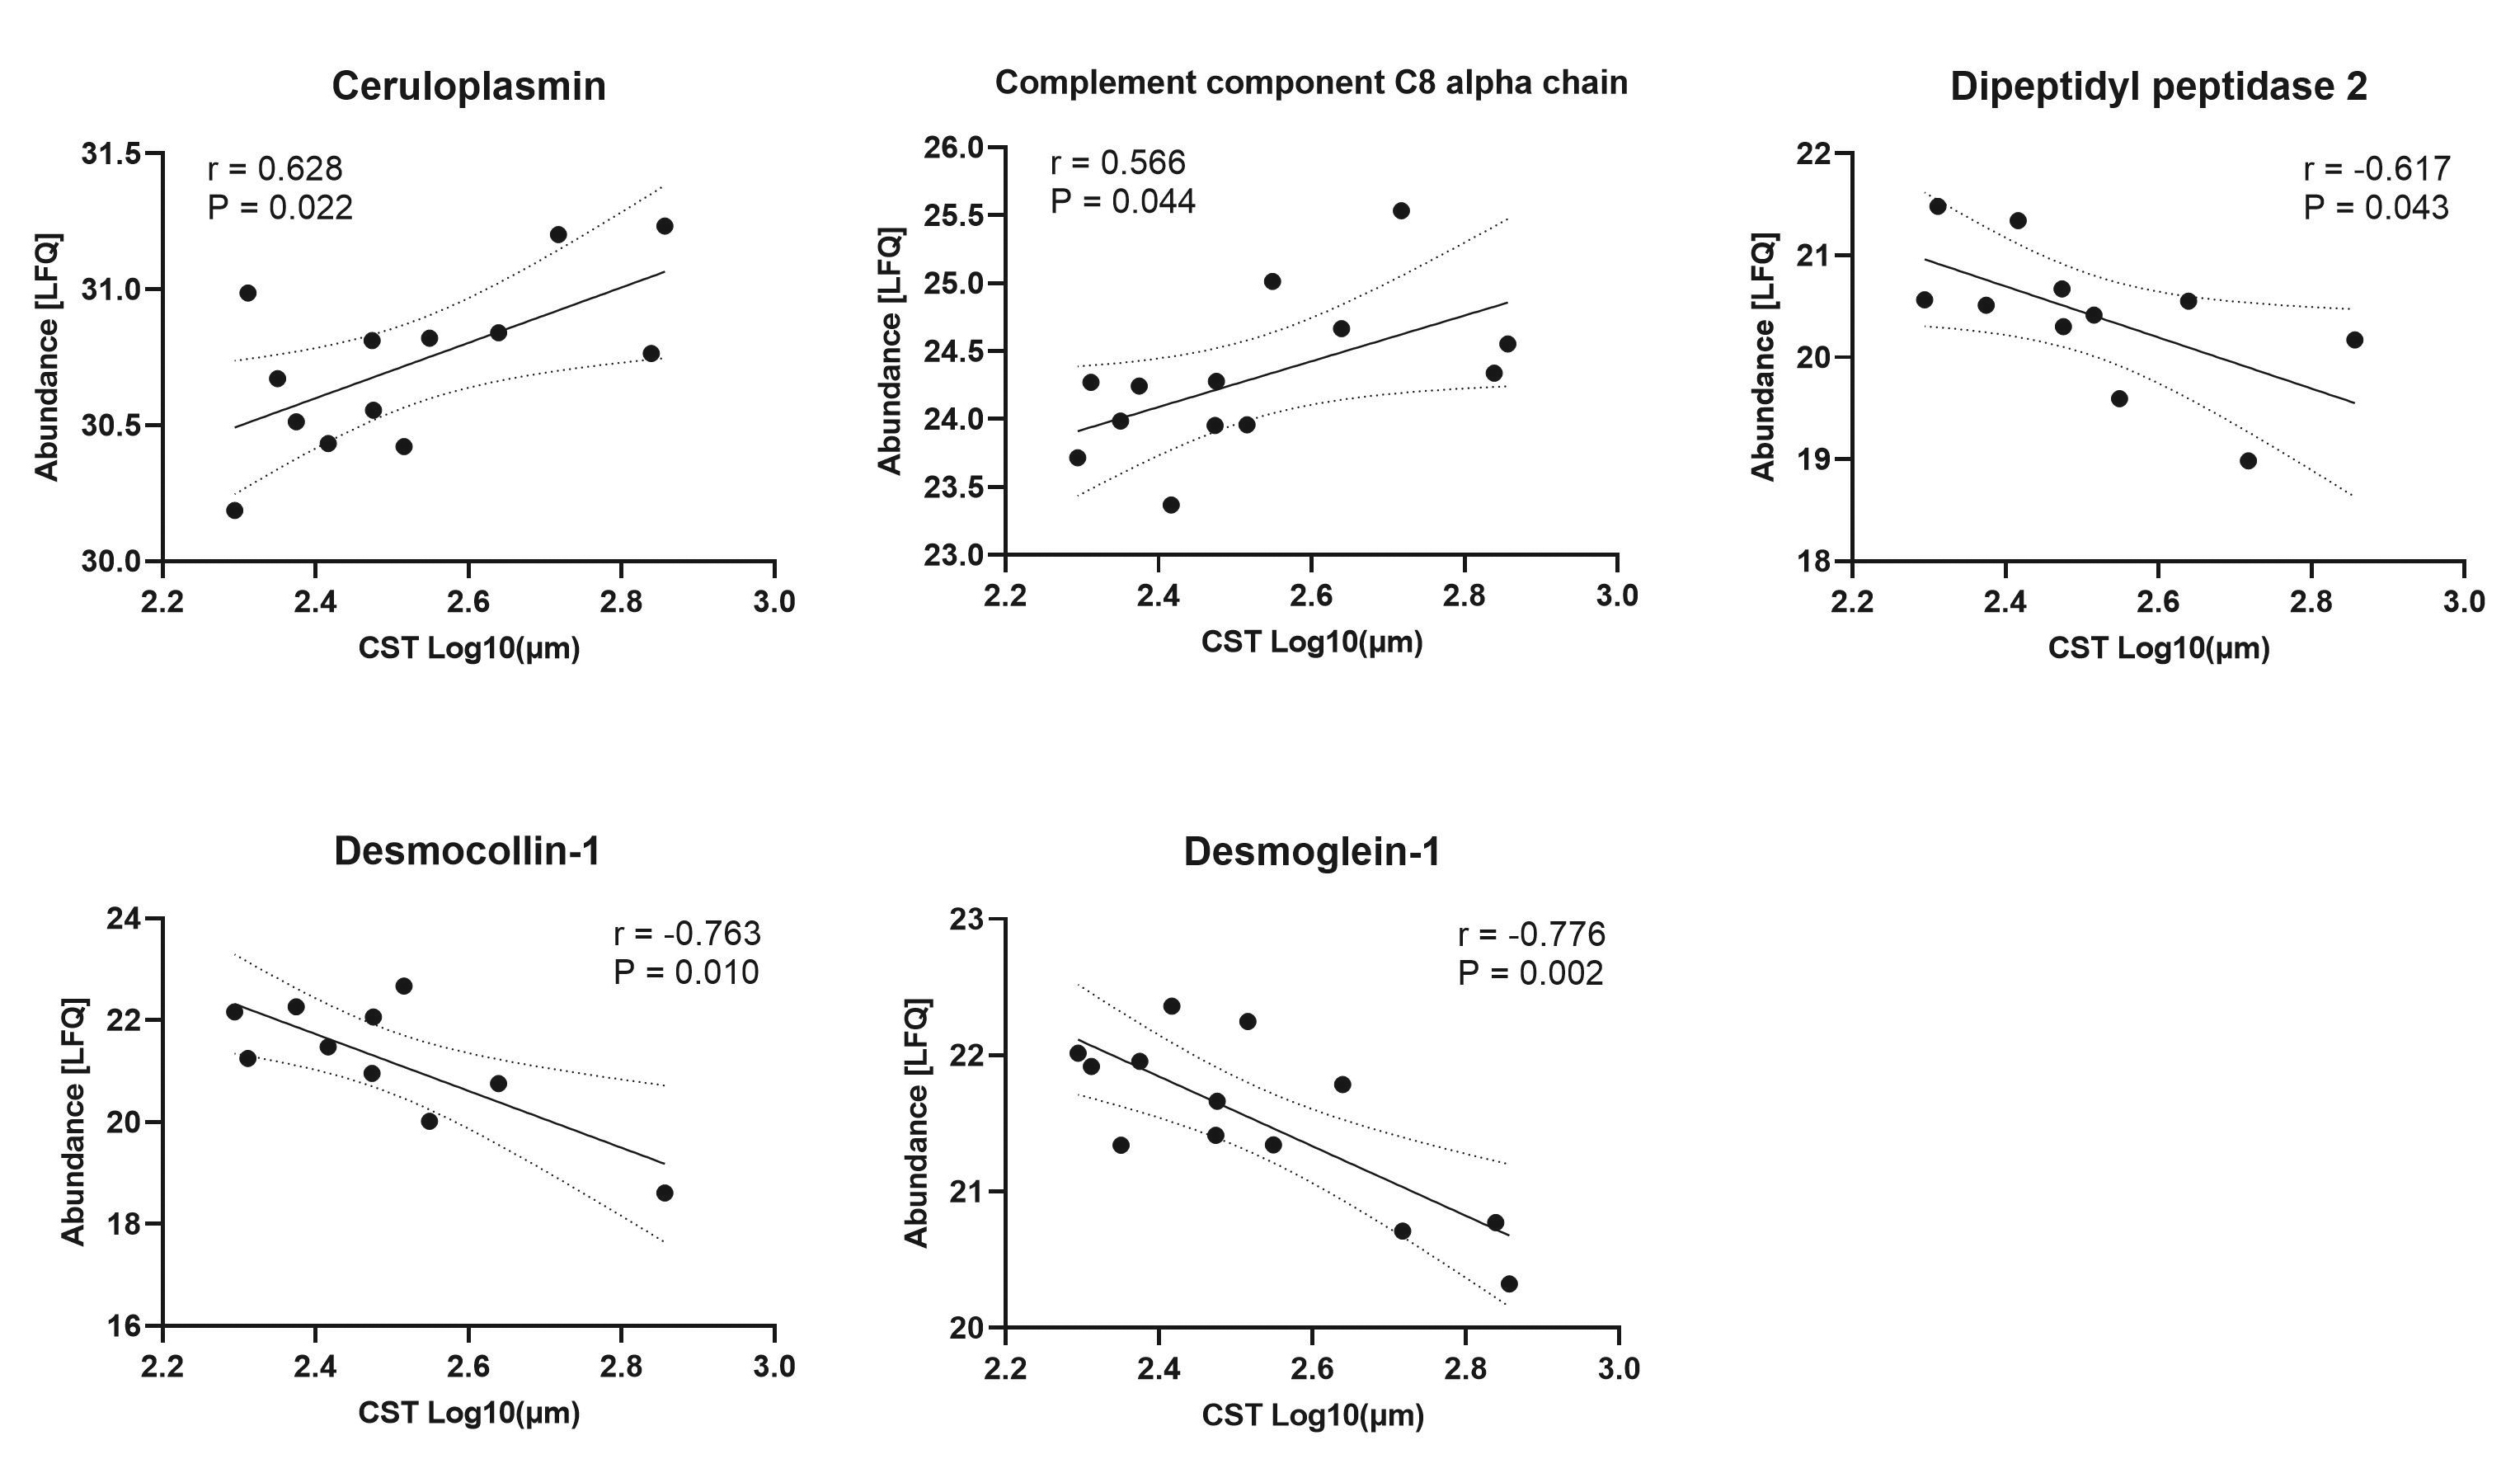
 Figure 6 of
Cehofski, Mol Vis 2024; 30:17-35.
Figure 6 of
Cehofski, Mol Vis 2024; 30:17-35.