Figure 6. Ischemia/reperfusion damage was worsened by overexpression of EphB1 by AAV. The top panels show retinal thickness and cell
loss in the ganglion cell layer. Quantification of cell loss and retinal thickness is shown in graphs below the images. *p<0.05
versus AAV control, #p<0.05 versus AAV control I/R. n=5 for all groups. Data are mean ± SEM.
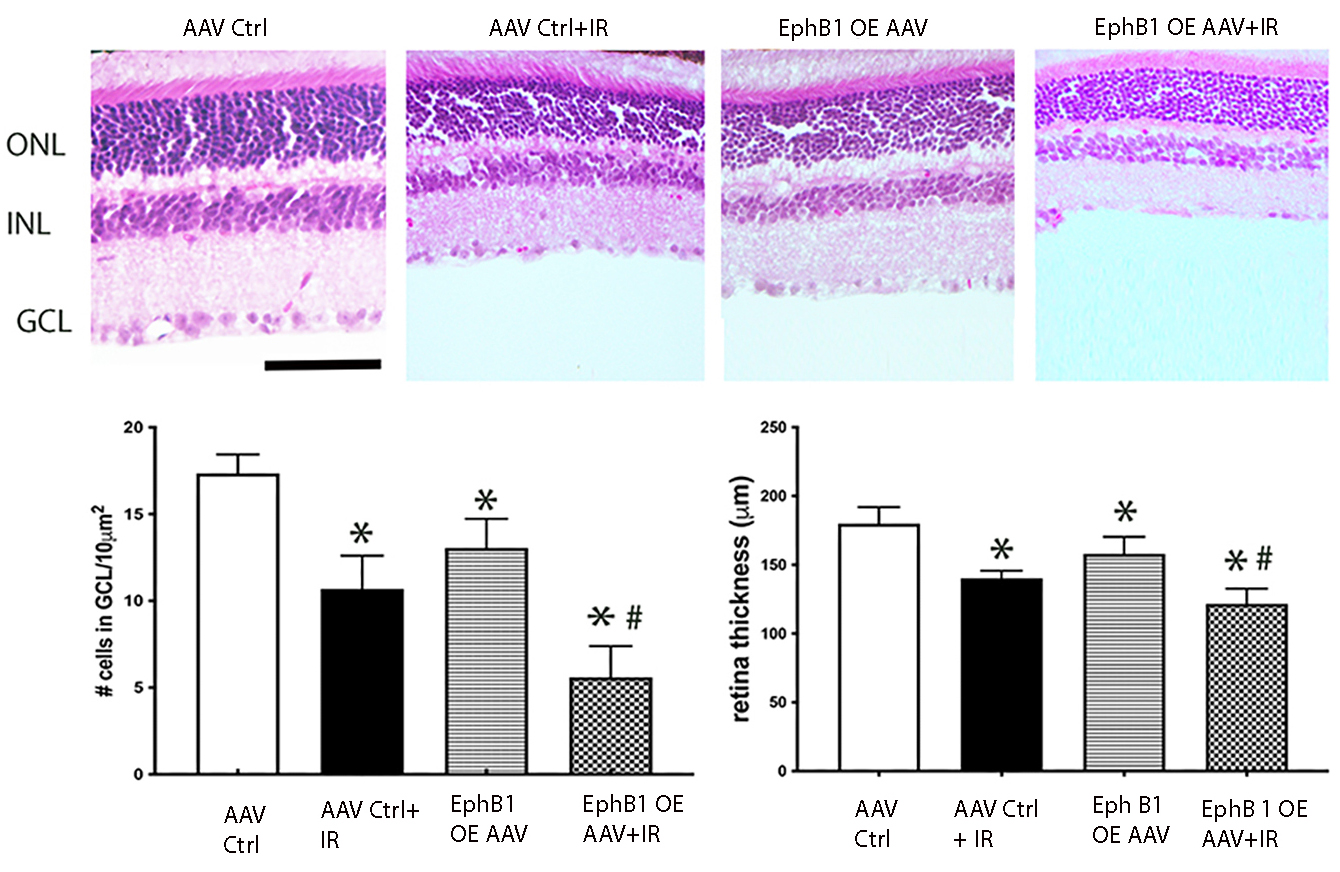
 Figure 6 of
Liu, Mol Vis 2024; 30:167-174.
Figure 6 of
Liu, Mol Vis 2024; 30:167-174.