Figure 2. EphB1 is increased in rMC-1 Müller cells. Panel A shows the localization of EphB1 in rMC-1 cells in culture in normal glucose
(top) and high glucose (bottom). Cells are stained with green for EphB1 and DAPI for nuclear localization. Panel B is western
blot data from rMC-1 cells grown in normal (5 mM) or high (25 mM) glucose. *p<0.05 versus normal glucose (NG), n=5 for the
western blot. Data are presented as mean ± SEM. Scale bar is 25 µm.
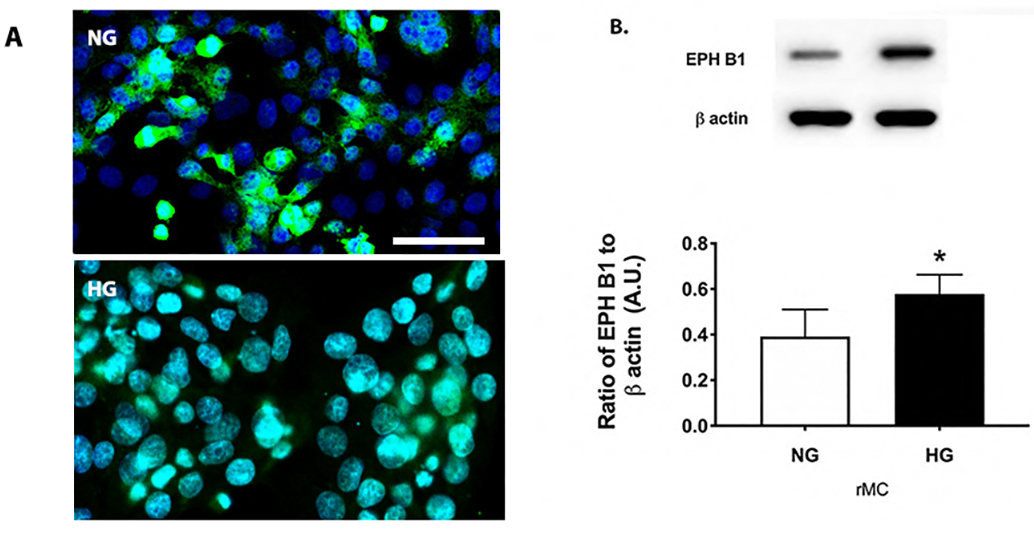
 Figure 2 of
Liu, Mol Vis 2024; 30:167-174.
Figure 2 of
Liu, Mol Vis 2024; 30:167-174.