Figure 5 of
Wen, Mol Vis 2024; 30:137-149.
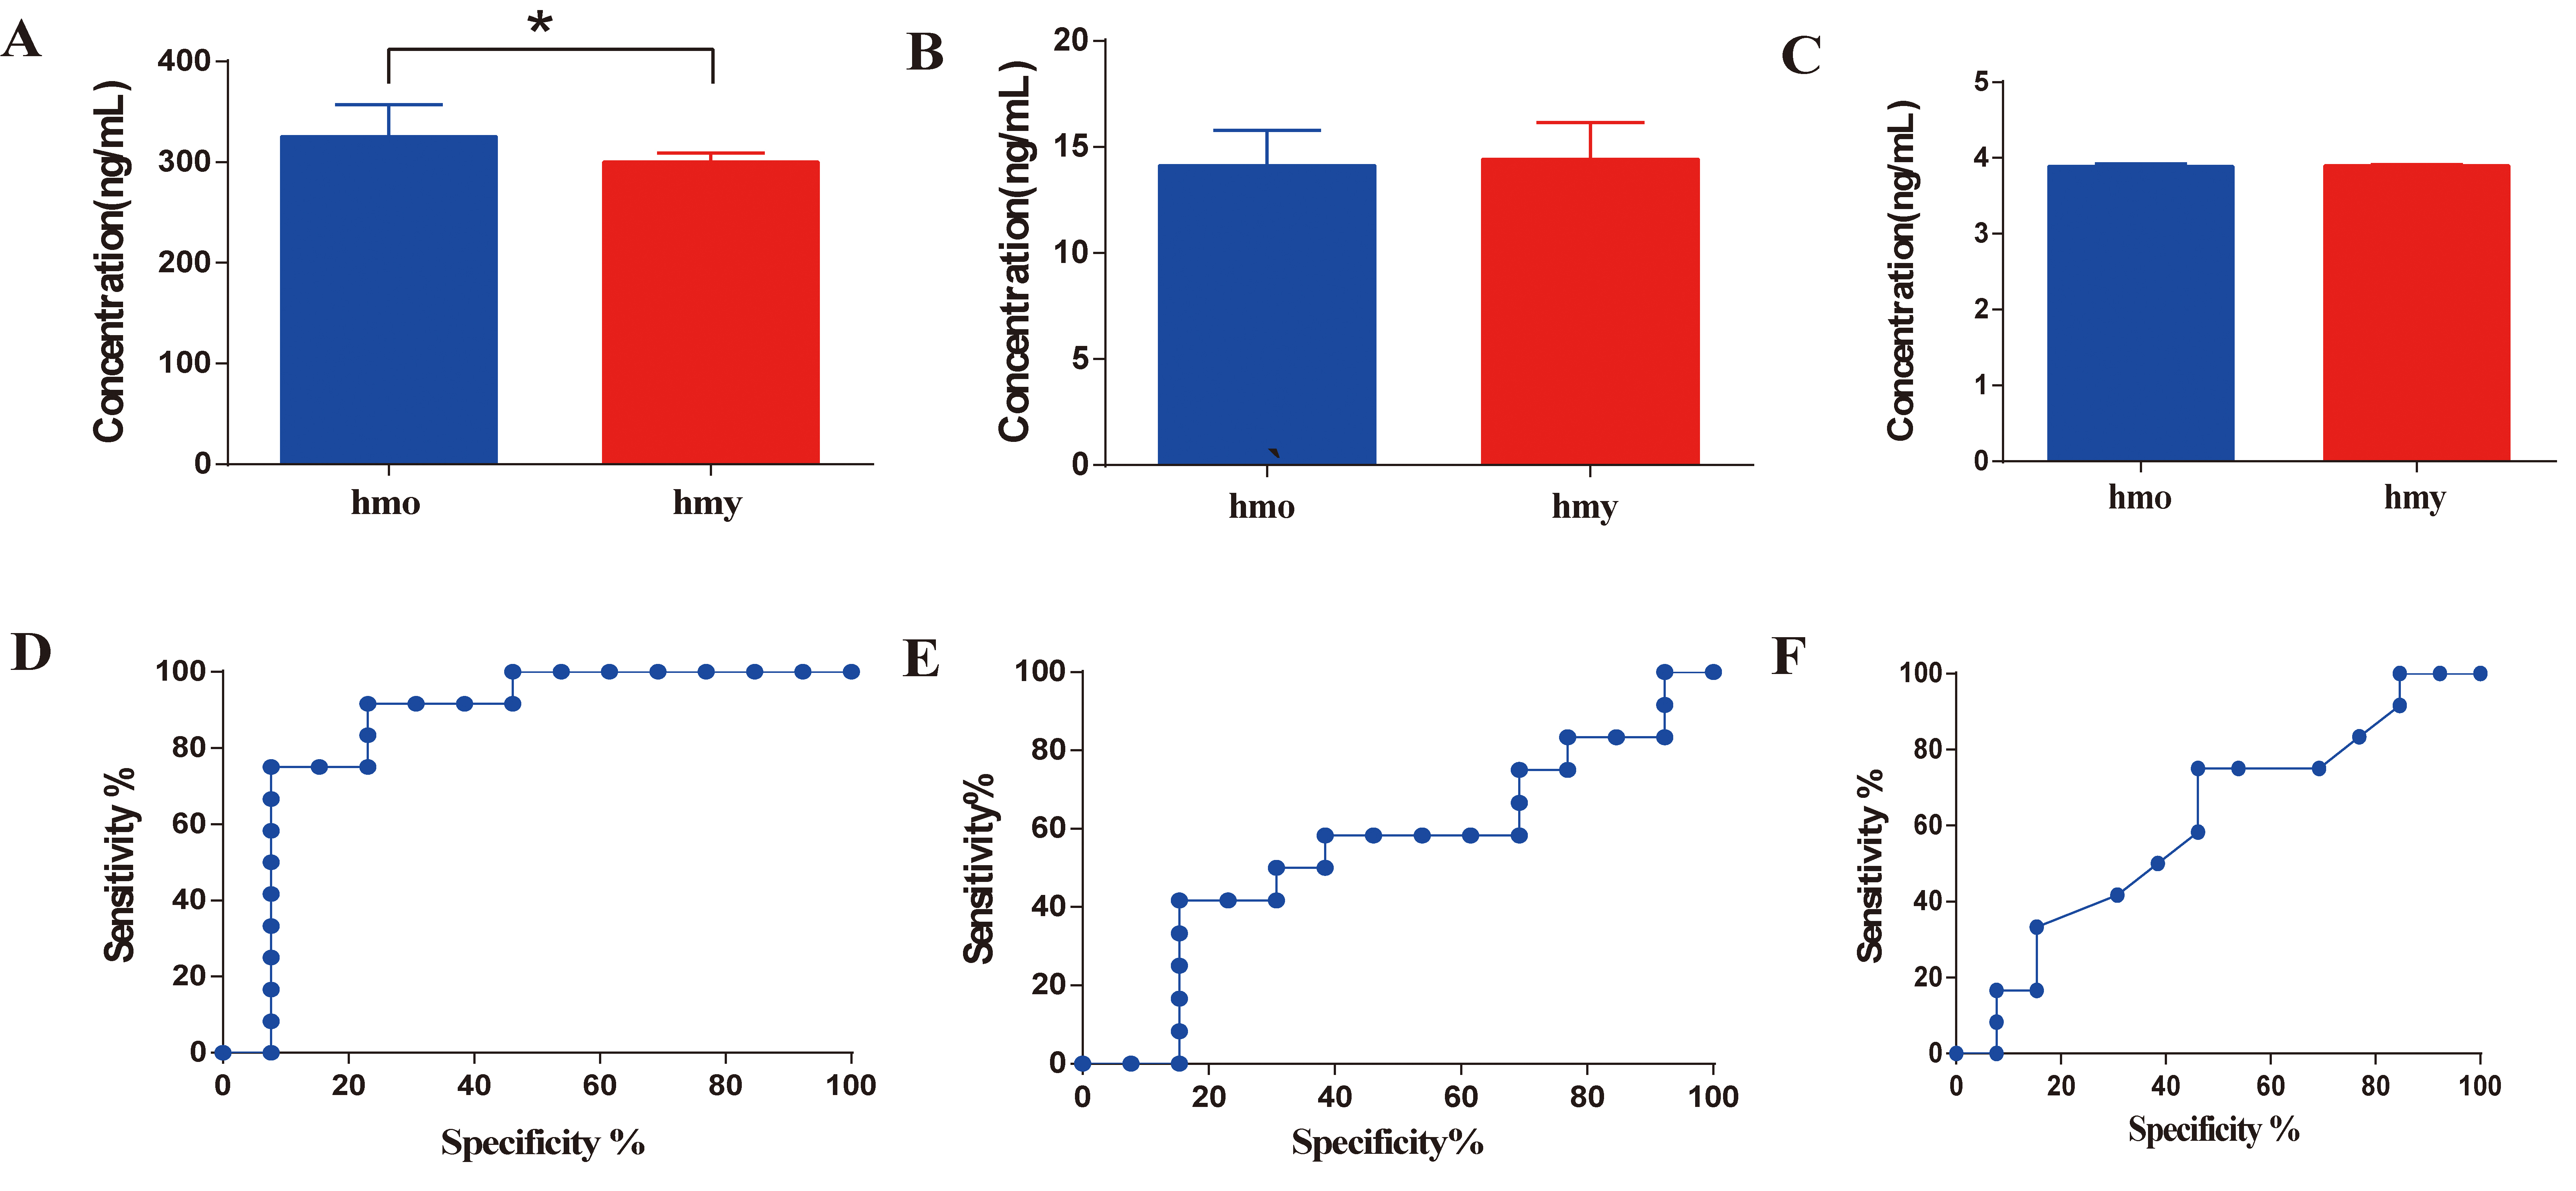
Figure 5.
ELISA verification results.
A-C
: Result of Alpha-1-antitrypsin, KNG-1, and PLG of ELISA, respectively.
D-F
: Result of Alpha-1-antitrypsin, KNG-1, and PLG of ROC curve analysis for the specificity and sensitivity, respectively. *, p<0.05.
 Figure 5 of
Wen, Mol Vis 2024; 30:137-149.
Figure 5 of
Wen, Mol Vis 2024; 30:137-149.