Figure 3. KEGG analysis of DEPs. A, B: Kyoto Encyclopedia of Genes and Genomes (KEGG) enrichment analysis of DEPs (select the top 10 by the value of p.adjust).
C: Pathway metabolic pathway annotation of DEPs. Pearson correlation analysis of the proteins involved in the gene set enrichment
analysis (GSEA) complement coagulation cascade. D: Pathway enrichment butterfly diagram for the upregulation and downregulation of DEPs.
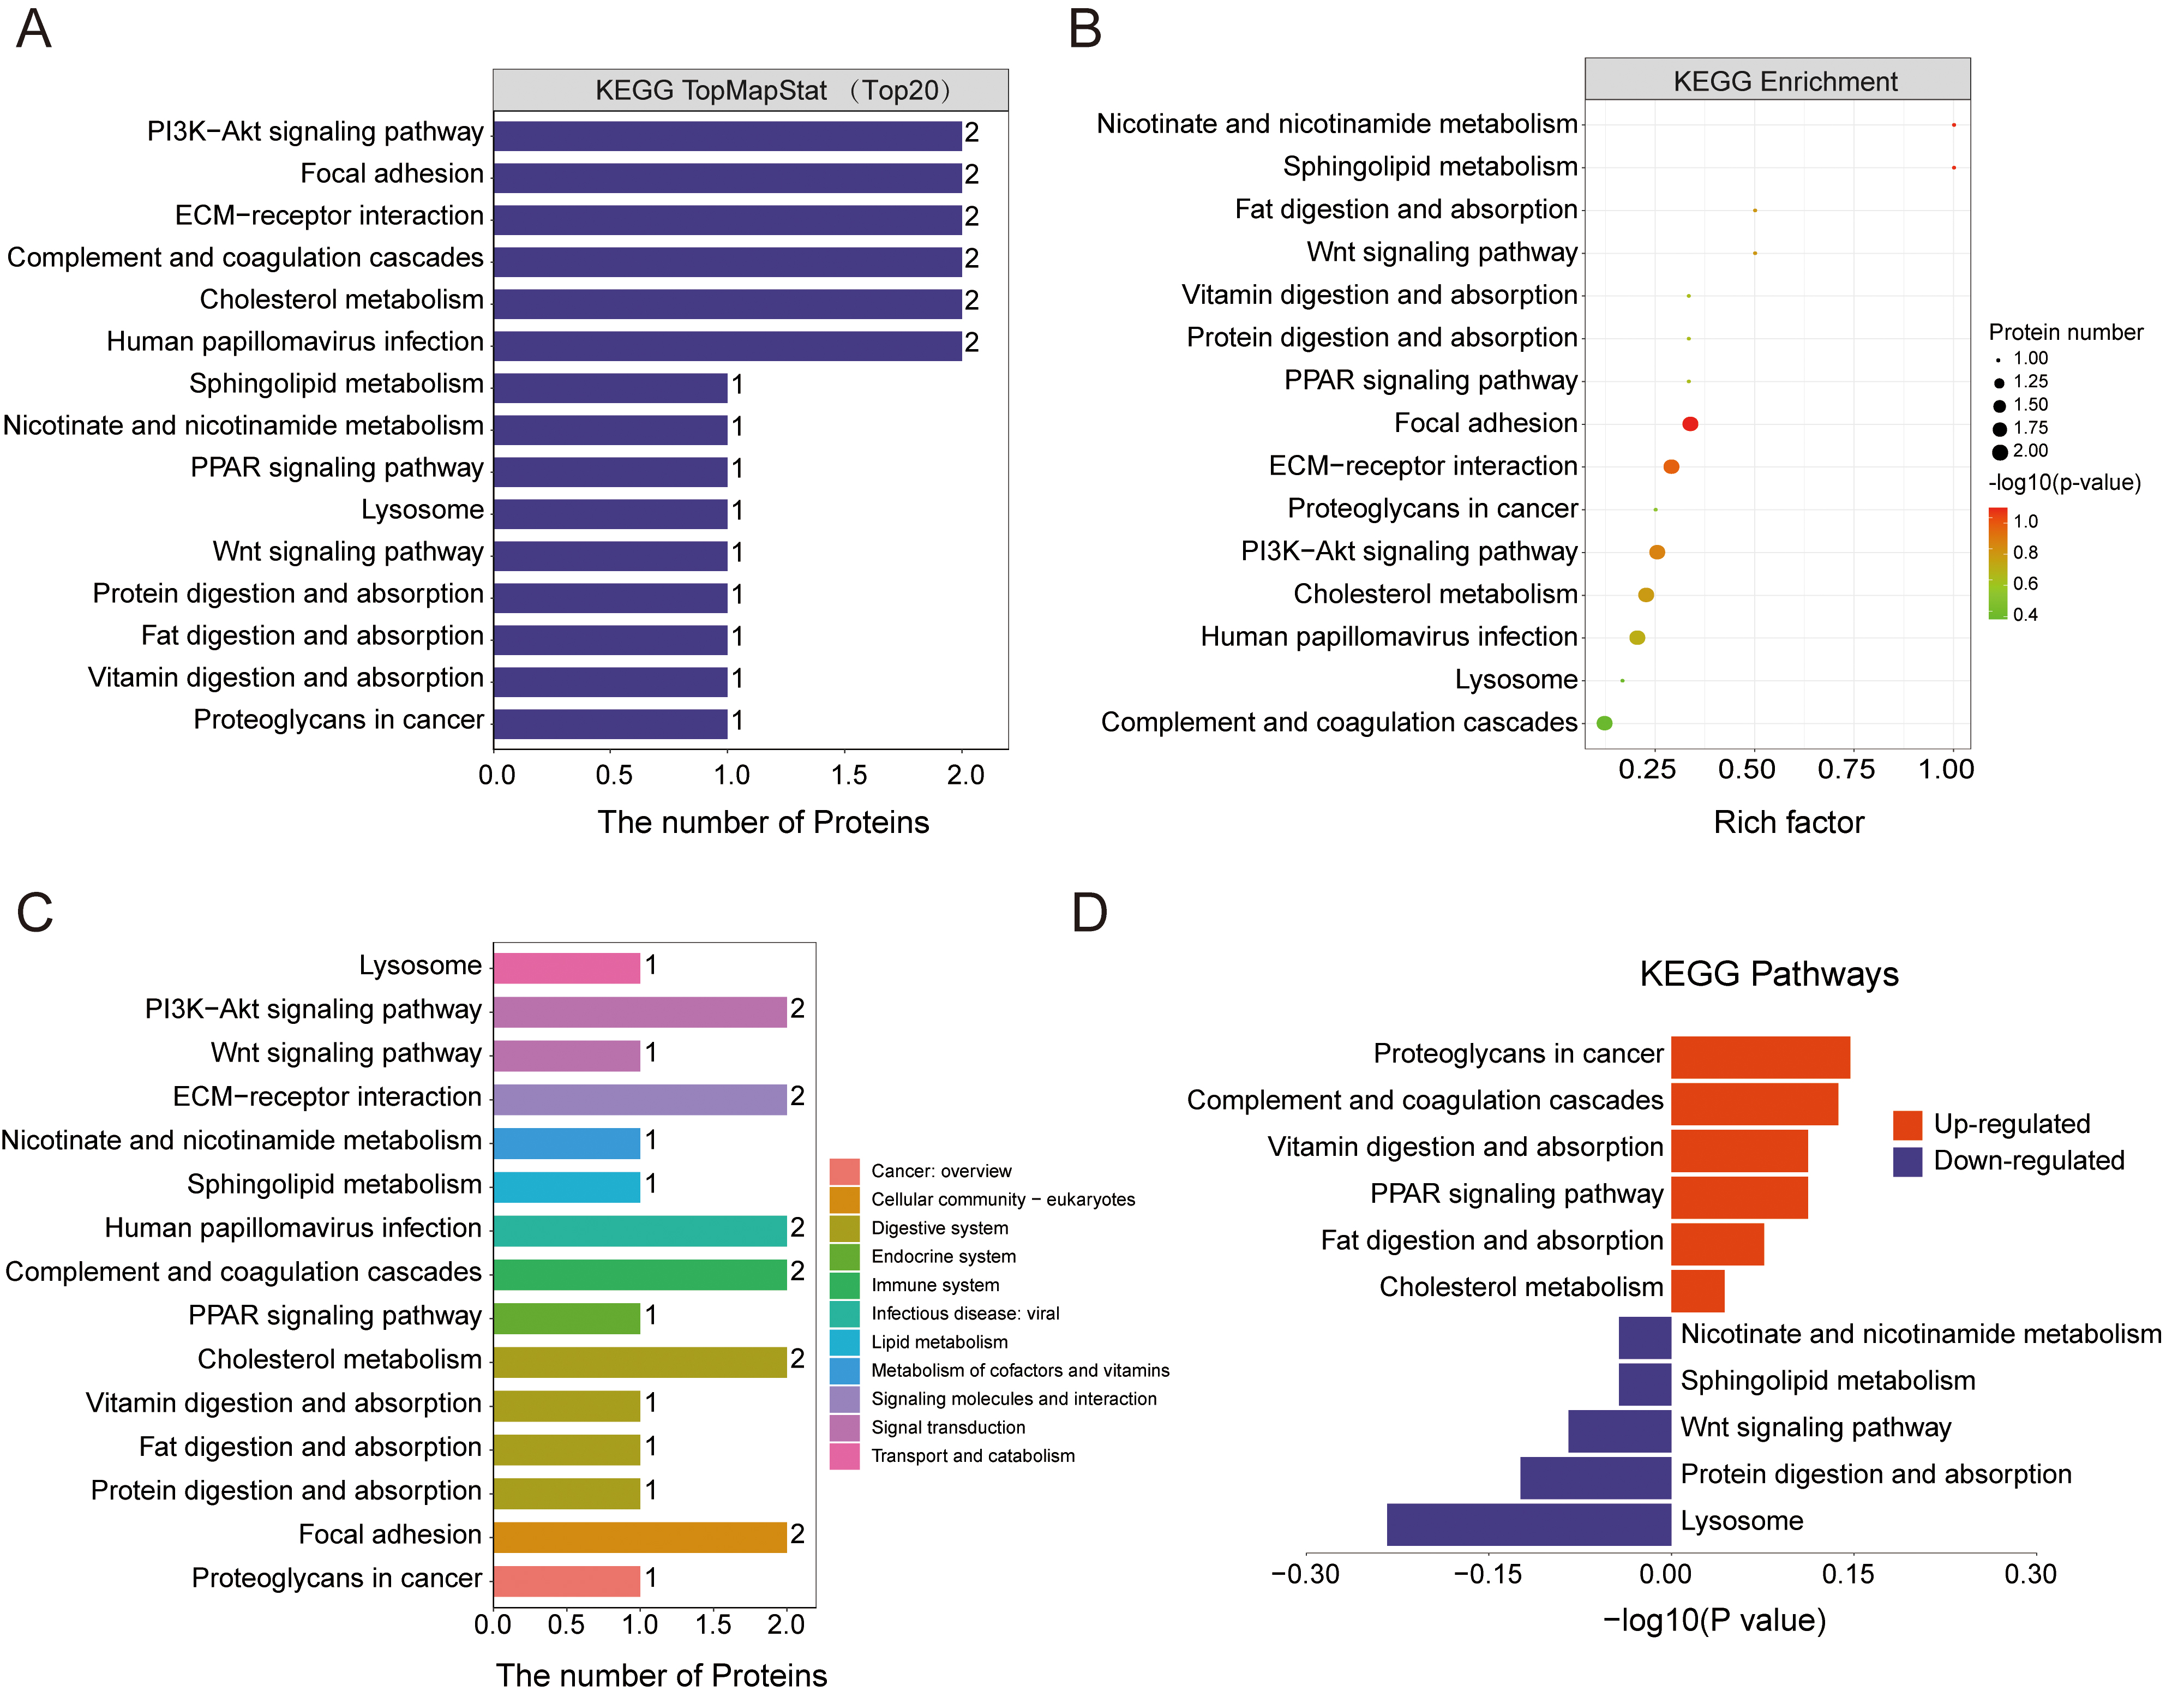
 Figure 3 of
Wen, Mol Vis 2024; 30:137-149.
Figure 3 of
Wen, Mol Vis 2024; 30:137-149.