![]() Figure 4 of
Lin, Mol Vis 3:17, 1997.
Figure 4 of
Lin, Mol Vis 3:17, 1997.
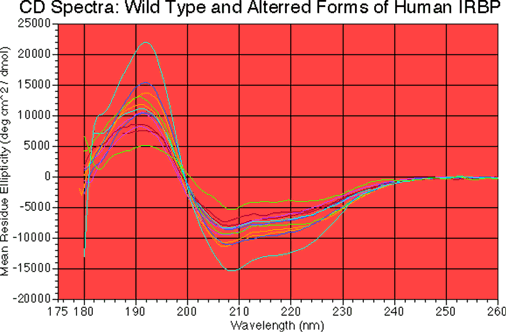
Figure 4. CD Spectra.
Samples of roughly 200-500 µg/ml protein in 5 mM NaPO4 pH 6.5, and were scanned from 350 to 170 nm. Mean residue ellipticities, on the ordinate, were calculated based on protein concentrations approximately estimated from absorbance at 205 nm (assuming 31 A per mg/ml per cm) and the average residue weight calculated from each exact individual amino acid sequence. The curves from top to bottom at 191.5 nm represent EcR3, R725C, EcR1, R12-, R12+, wild type batch 3, EcR2, wild type batch 4, R123, G719S, R1, and EcR4. No substantial differences in the shape of the curves exist among the spectra, suggesting that the general conformations of the proteins are much the same as wild type. Differences in the magnitudes of the mean residue ellipticities exist. These differences reflect differences in the purity and protein concentration of the preparations. Regarding the latter, utility of the A205 measurements is limited. However, the key point is that the proteins all appear to have the same gross conformation.
