![]() Figure 4 of
Phillips, Mol Vis 3:12, 1997.
Figure 4 of
Phillips, Mol Vis 3:12, 1997.
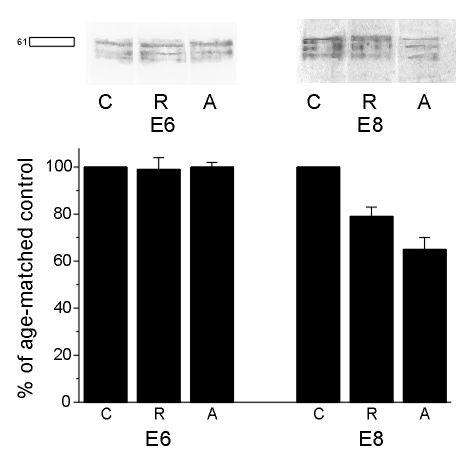
Figure 4. Effects of antisense treatments on glutamic acid decarboxylase (GAD) protein levels in E6 and E8 retinal cell cultures
For the representative Western blots, each lane contained 14 µg total protein for the E6 samples and 24 µg total protein for the E8 samples. The blots were probed with polyclonal antiserum against GAD (diluted 1:1000) and exposed for 1 min. The area used to quantitate the 61 kDa GAD band is indicated by the box. The density scan is of cumulative data from Western blots of three separate experiments probed with anti-GAD. Levels of GAD in untreated cultures have been normalized and protein levels are expressed as percentages of the control. (C = control not treated with any oligonucleotide; R = treatment with 20 µM random oligonucleotide; A = treatment with 20 µM antisense oligonucleotide)
