![]() Figure 1 of
Phillips, Mol Vis 3:12, 1997.
Figure 1 of
Phillips, Mol Vis 3:12, 1997.
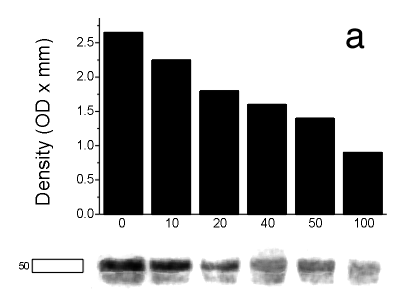
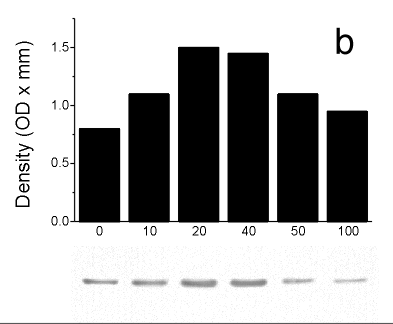
Figure 1. R-cognin and GAPDH protein levels in E8 retina cell cultures after treatment with increasing concentrations of antisense oligonucleotide to R-cognin
(a) Density scan and Western blot with R-cognin antibody (dil 1:100) and exposed for 1 min. The amount of R-cognin antisense oligonucleotide added is shown in µM underneath the density scan.

(b) Density scan and Western blot with GAPDH antibody (diluted 1:250) and exposed for 10 min. Each lane contained 20 µg total protein. The amount of R-cognin antisense oligonucleotide added is shown in µM underneath the density scan.
