![]() Figure 5 of
Evans, Mol Vis 3:11, 1997.
Figure 5 of
Evans, Mol Vis 3:11, 1997.
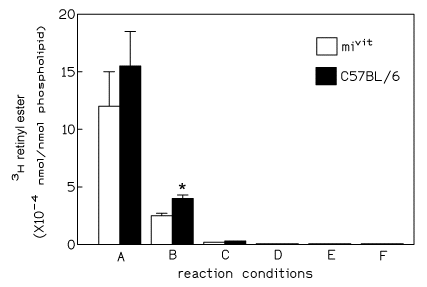
Figure 5. Bar Graph of 3H-retinol esterification to 3H-retinyl esters in RPE-enriched tissue.
Each assay included 20 µl RPE-enriched tissue from 15 animals at the indicated age, 10 µl 3H-retinol, 15 µl BSA. The reaction was terminated after 10 min.
(A) RPE-enriched tissue from 3 week old mice, the amount of 3H-retinol esterified to 3H-retinyl esters for vitiligo mouse samples (unshaded boxes) was not significantly different from that of the control mouse samples (shaded boxes). p=0.055, t=-5.733.
(B) RPE-enriched tissue from 9 week old mice, 3H-retinol esterification to 3H-retinyl esters in the vitiligo mouse samples was only 50% and was significantly different (marked by *) from control samples (p<0.001, t=-44.529). Each esterification assay was performed using RPE-enriched tissue obtained from 30 eyes (per mouse group). Each assay was performed twice.
(C) Samples were boiled for 3 min prior to the assay, the low level radioactivity represents the residual tritium (background radioactivity) found in the assay.
(D) RPE-enriched tissue was omitted from the reaction mixture, no esterification occurred.
(E) 3H-retinol was omitted, esterification did not occur.
(F) A sample of sclera/choroid tissue was also assayed, after having brushed away the RPE, no esterification was detected.
