![]() Figure 3 of
Evans, Mol Vis 3:11, 1997.
Figure 3 of
Evans, Mol Vis 3:11, 1997.
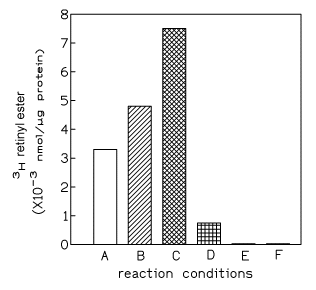
Figure 3. Bar graph of 3H-retinol esterification to 3H-retinyl esters in liver microsomes.
As a positive control, liver microsome samples were prepared from vitiligo mice and subjected to various reaction conditions.
(A) The esterification reaction was allowed to proceed for 10 min in the presence of liver microsomes prior to terminating the reaction with cold ethanol.
(B) 20 min reaction.
(C) 30 min reaction.
(D) Liver microsome sample was boiled for 3 min prior to being subjected to a 10 min reaction. The low level radioactivity represents the residual tritium (background radioactivity) found in the assay.
(E) No 3H-retinyl esters were produced when the reaction was attempted for 10 min without the addition of liver microsomes.
(F) No 3H-retinyl esters were produced when the reaction was attempted for 10 min without the addition of 3H-retinol.
