![]() Figure 2 of
Evans, Mol Vis 3:11, 1997.
Figure 2 of
Evans, Mol Vis 3:11, 1997.
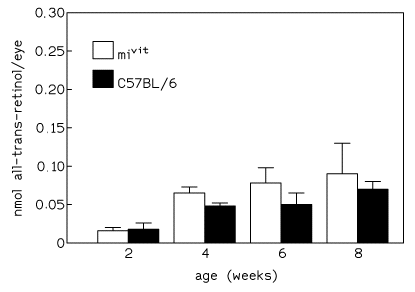
Figure 2. Bar graphs of retinol concentrations in the RPE/choroid of vitiligo mice (unshaded boxes) compared to control mice (shaded boxes) at ages 2, 4, 6 and 8 weeks.
Each assay reflects data collected from four eyes. Four assays were completed at 2, 4 and 6 weeks and three at 8 weeks. Error bars represent the standard error. There were no significant differences at the ages examined. (p=0.214).
