Figure 6 of
Paterson, Mol Vis 2023; 29:87-101.
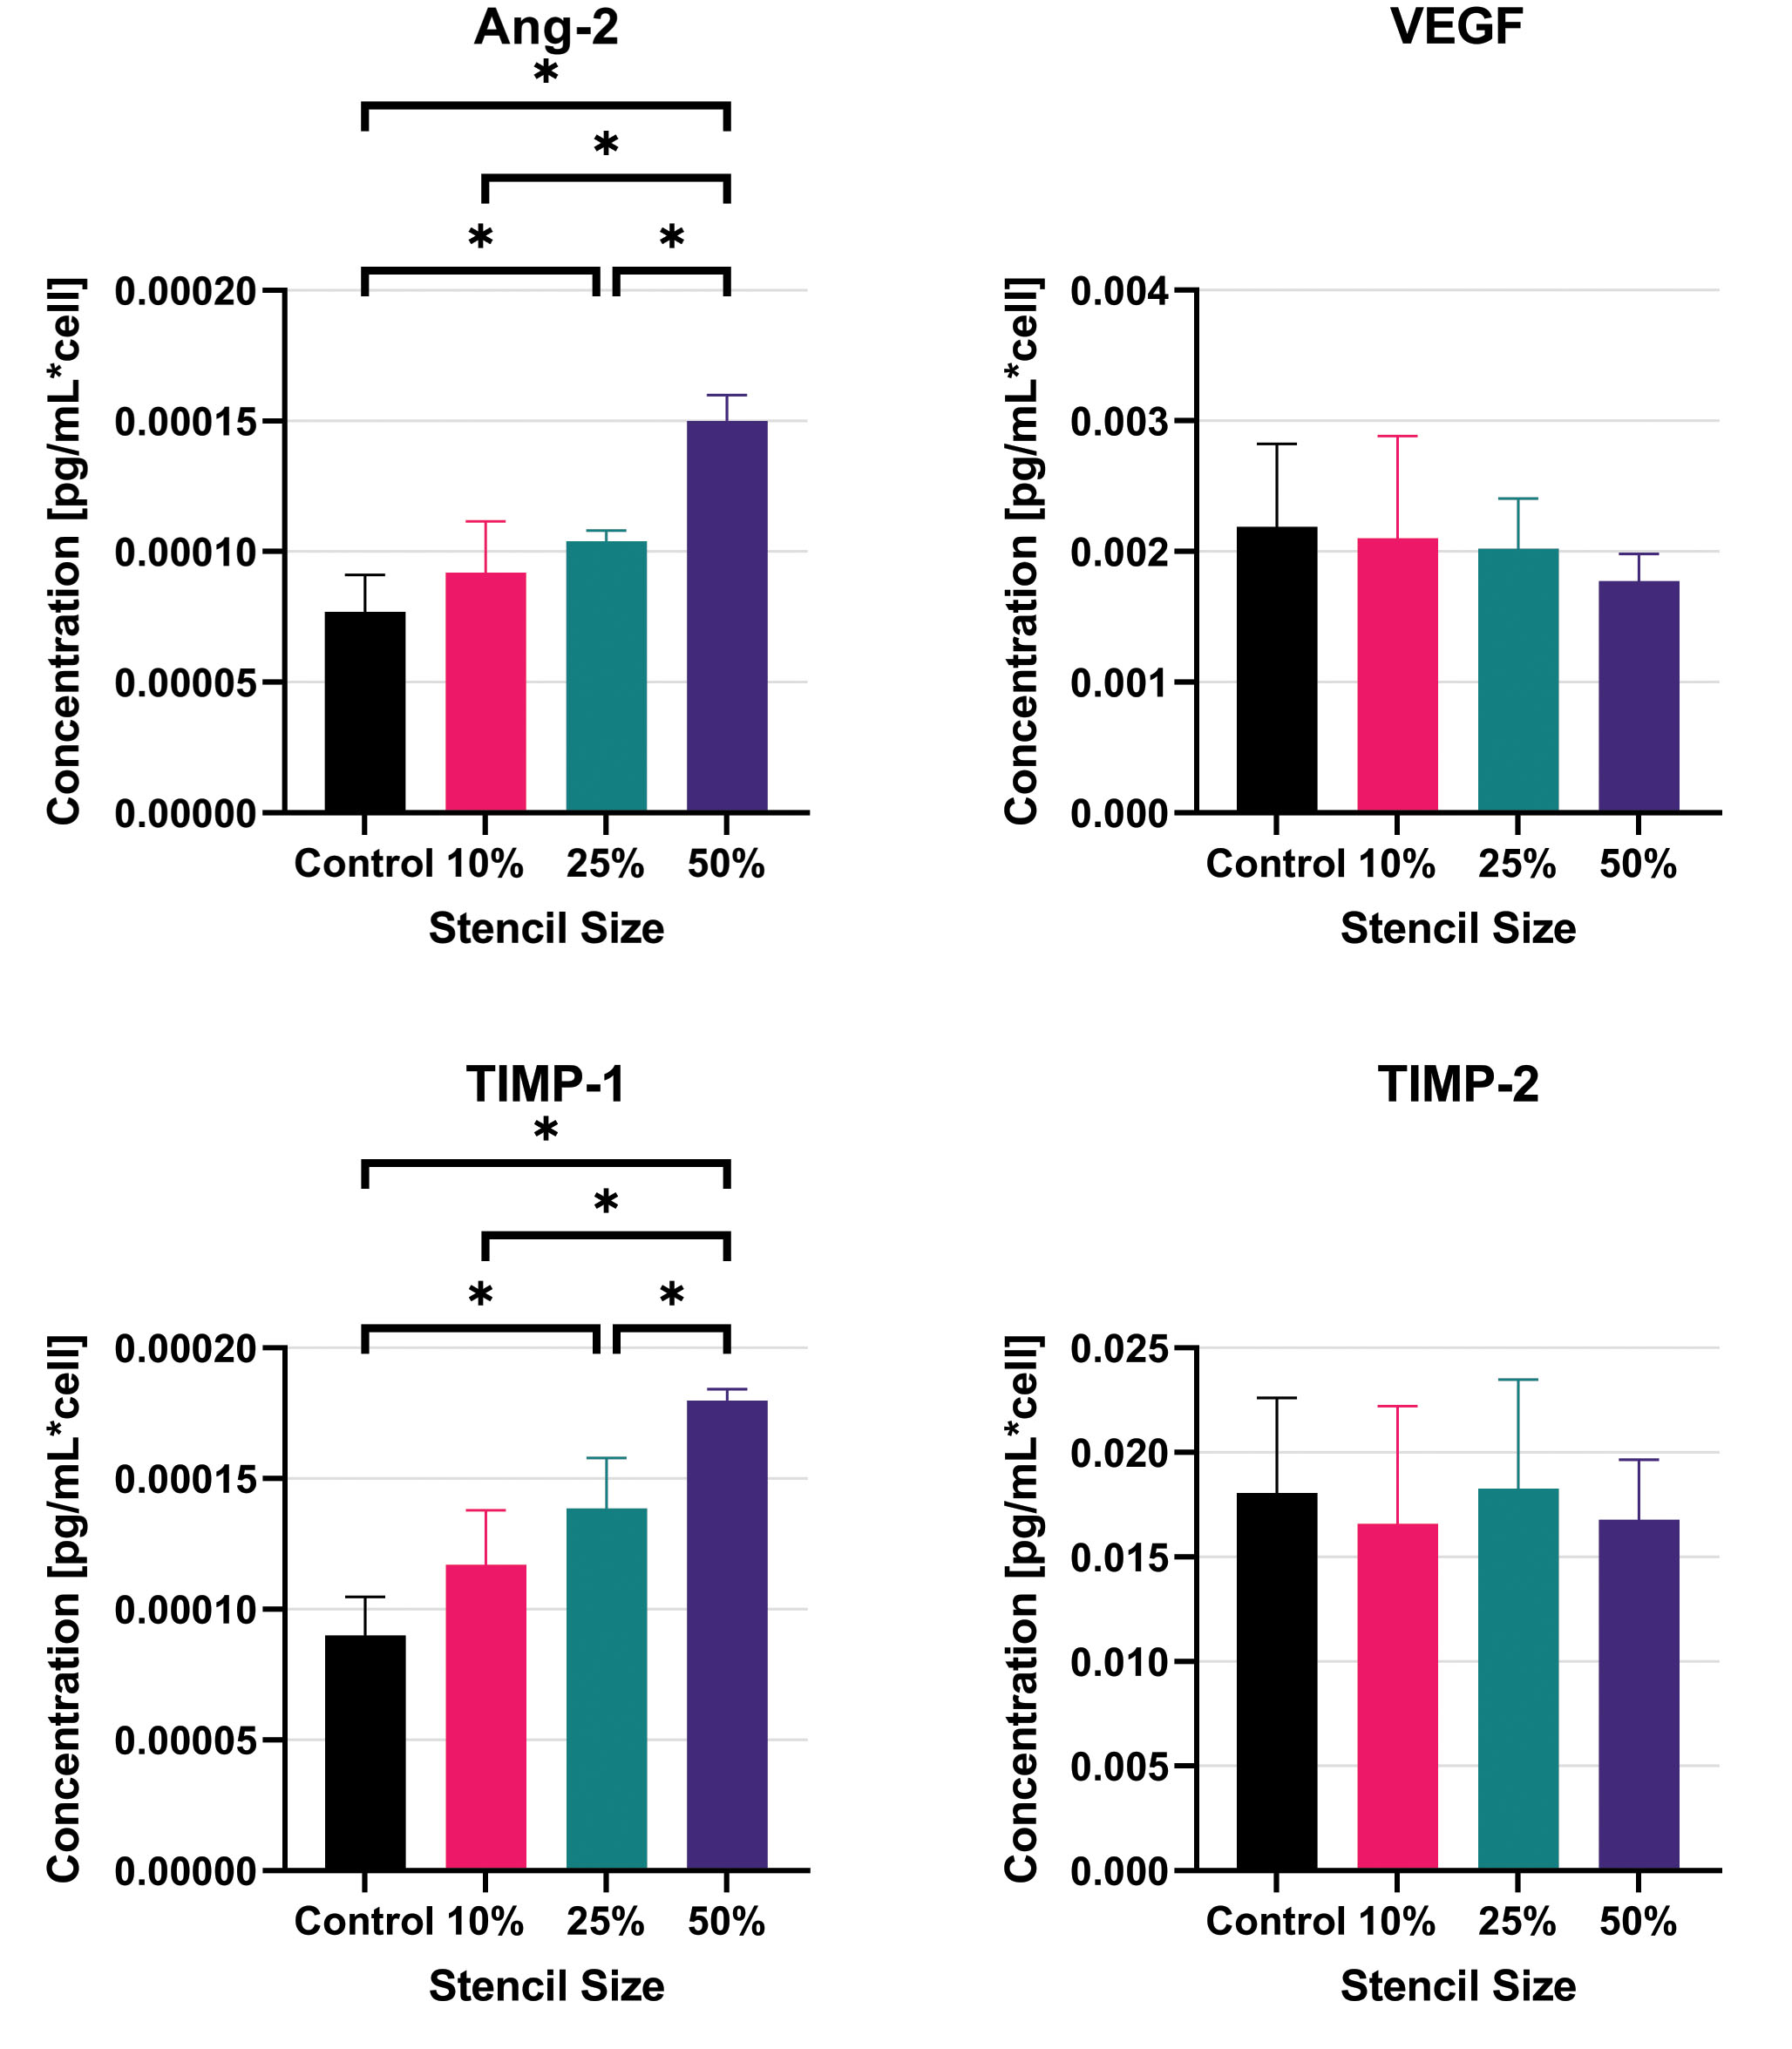
Figure 6.
Mean concentrations of Ang-2, VEGF, TIMP-1, and TIMP-2 proteins in cell media 1 day after stencil removal. Error bars represent standard deviations. *
p
-value < 0.05. Control (
n
= 7), 10% (
n
= 4), 25% (
n
= 4), 50% (
n
= 4).
 Figure 6 of
Paterson, Mol Vis 2023; 29:87-101.
Figure 6 of
Paterson, Mol Vis 2023; 29:87-101.