Figure 5. Visualization of Ang-2 (green), ZO-1 (red), and nuclei (blue) 1 day after the stencils were removed. A–E: Cells grown under
normal conditions exhibited less Ang-2 expression and more intercellular ZO-1 localization. F–T: Cells that responded to stencil
removal appeared to have increased Ang-2 expression. These cells also had more scattered ZO-1 localization (H, M, and R).
Scale bars: 50 µm.
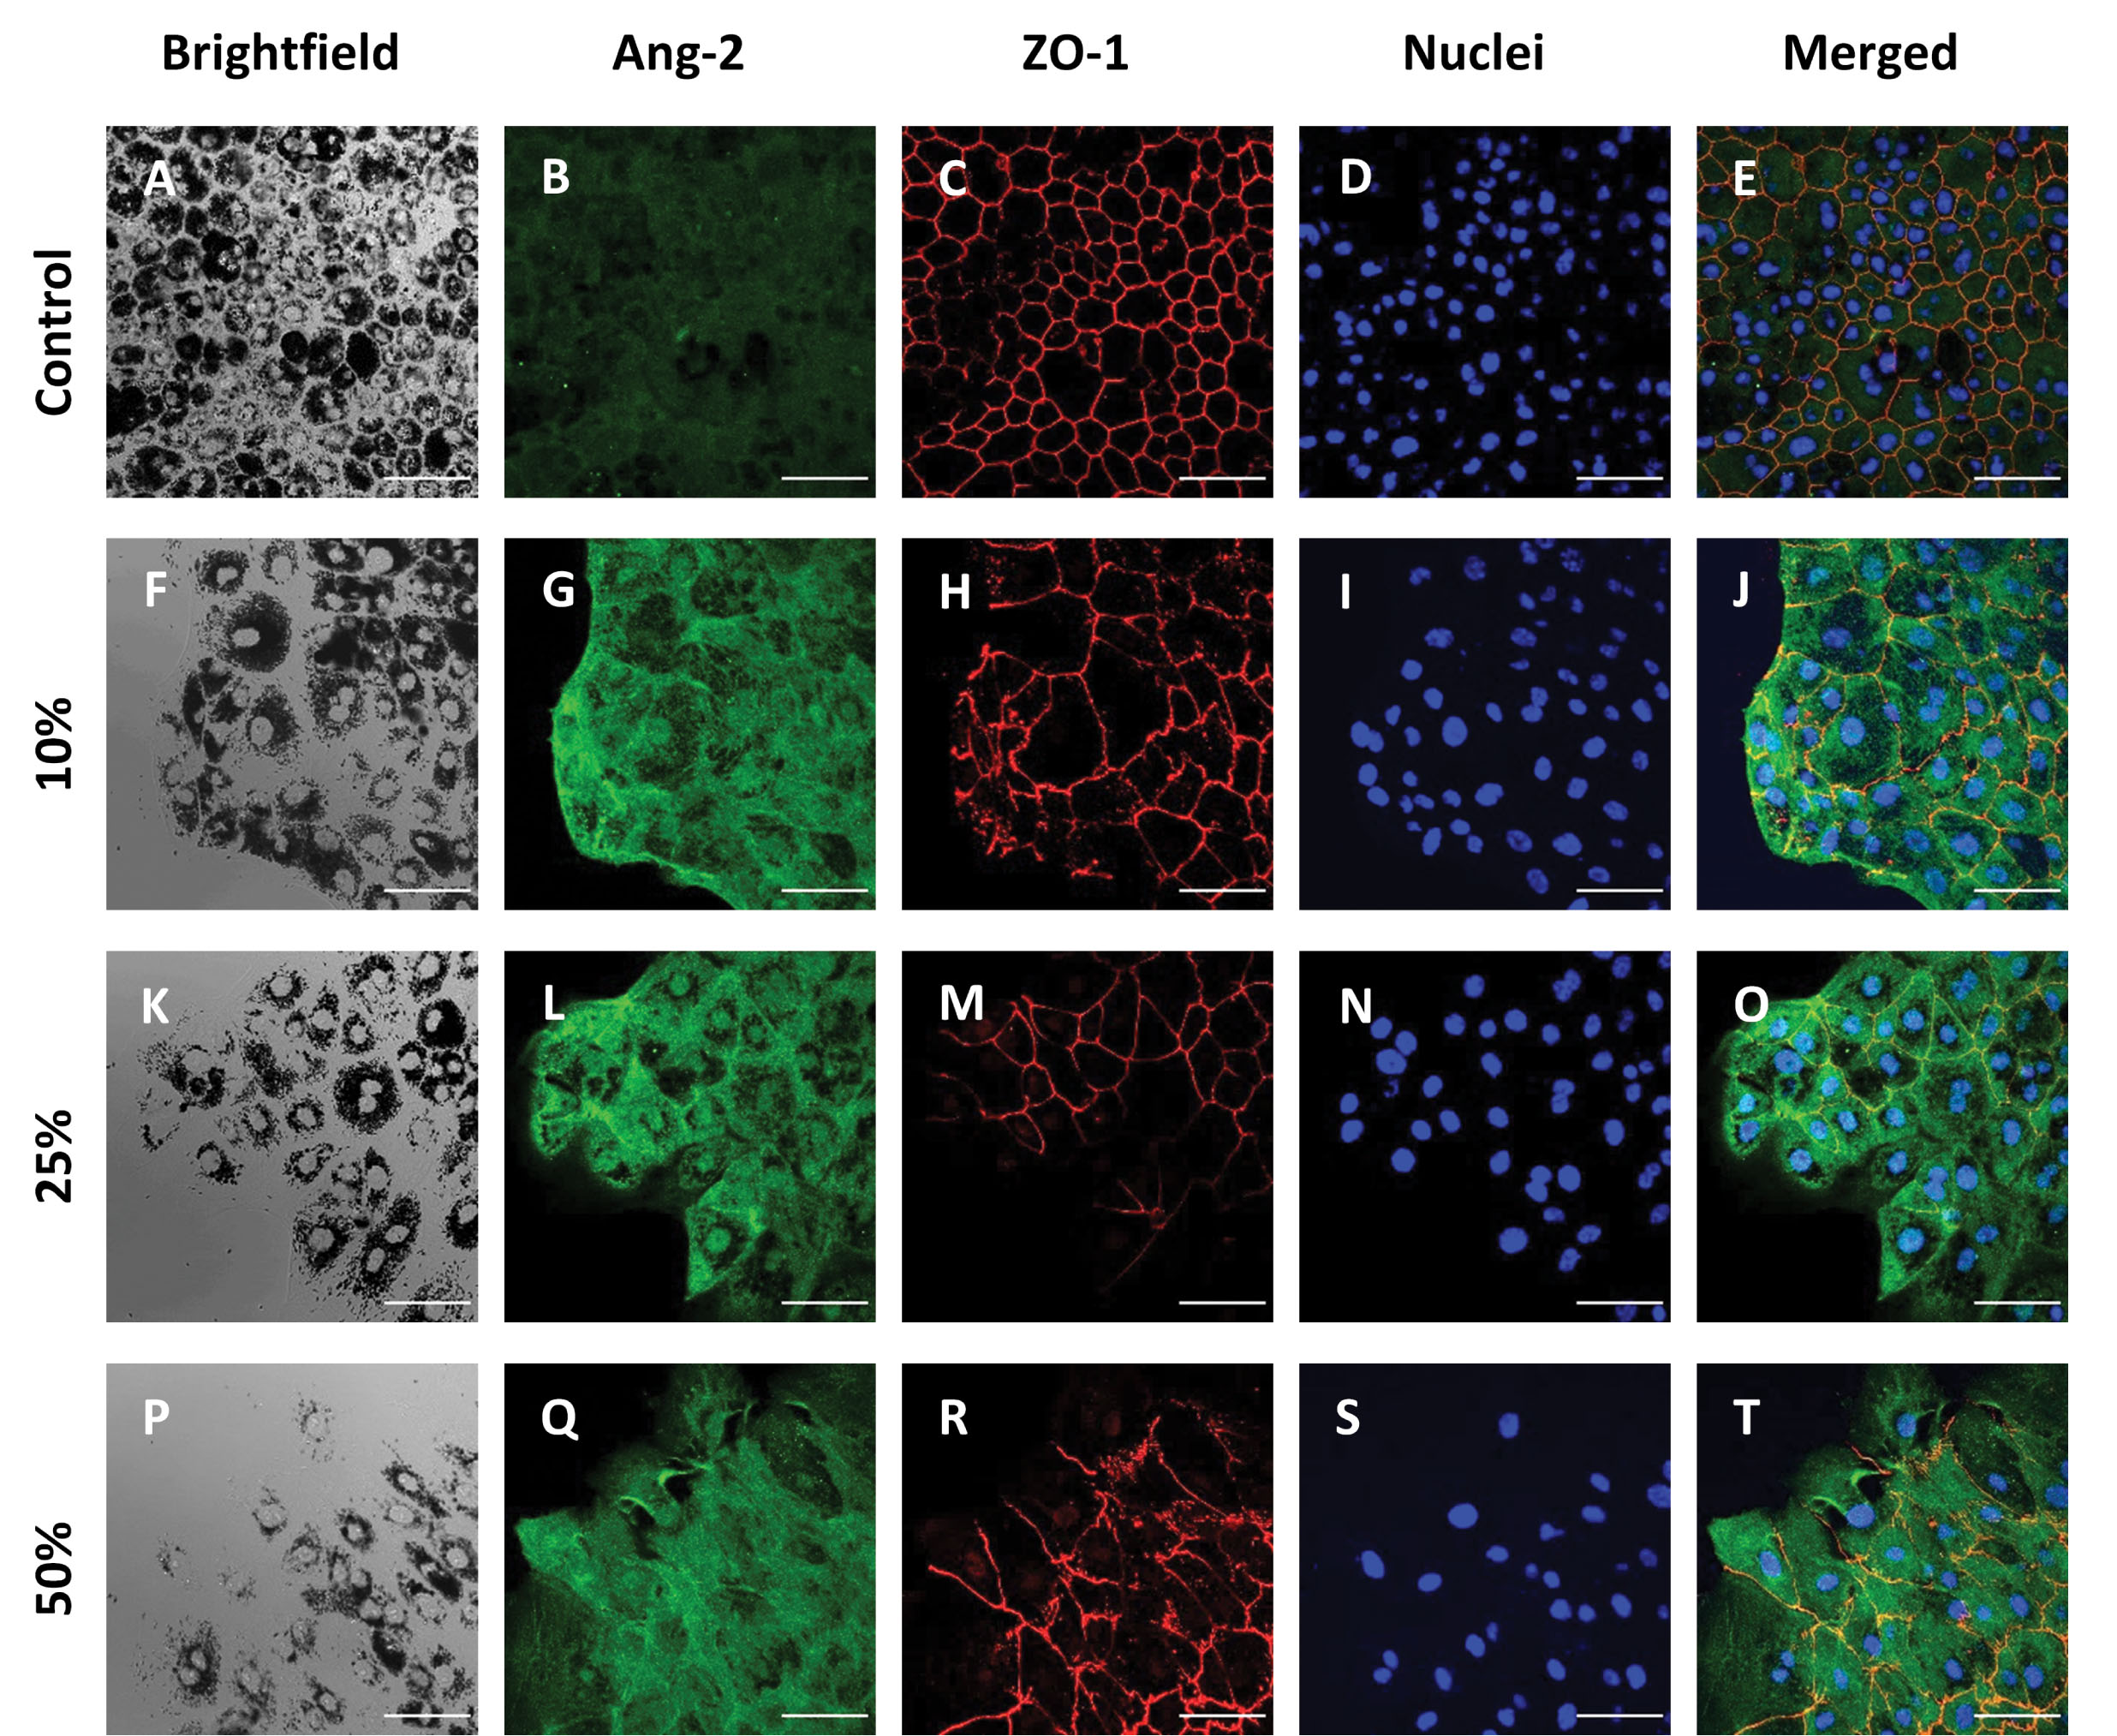
 Figure 5 of
Paterson, Mol Vis 2023; 29:87-101.
Figure 5 of
Paterson, Mol Vis 2023; 29:87-101.