Figure 4. Images of VEGF (green), ZO-1 (red), and nuclei (blue) 1 day after the stencils were removed. A–E: Cells grown under normal
conditions had uniform VEGF expression (B) and normal ZO-1 localization (C). F–T: Cells that experienced intercellular junction
removal appeared to have a higher expression of VEGF in some locations (arrows) but not consistently across edges of detachment.
These cells also had more scattered ZO-1 (H, M, and R). Scale bars: 50 µm.
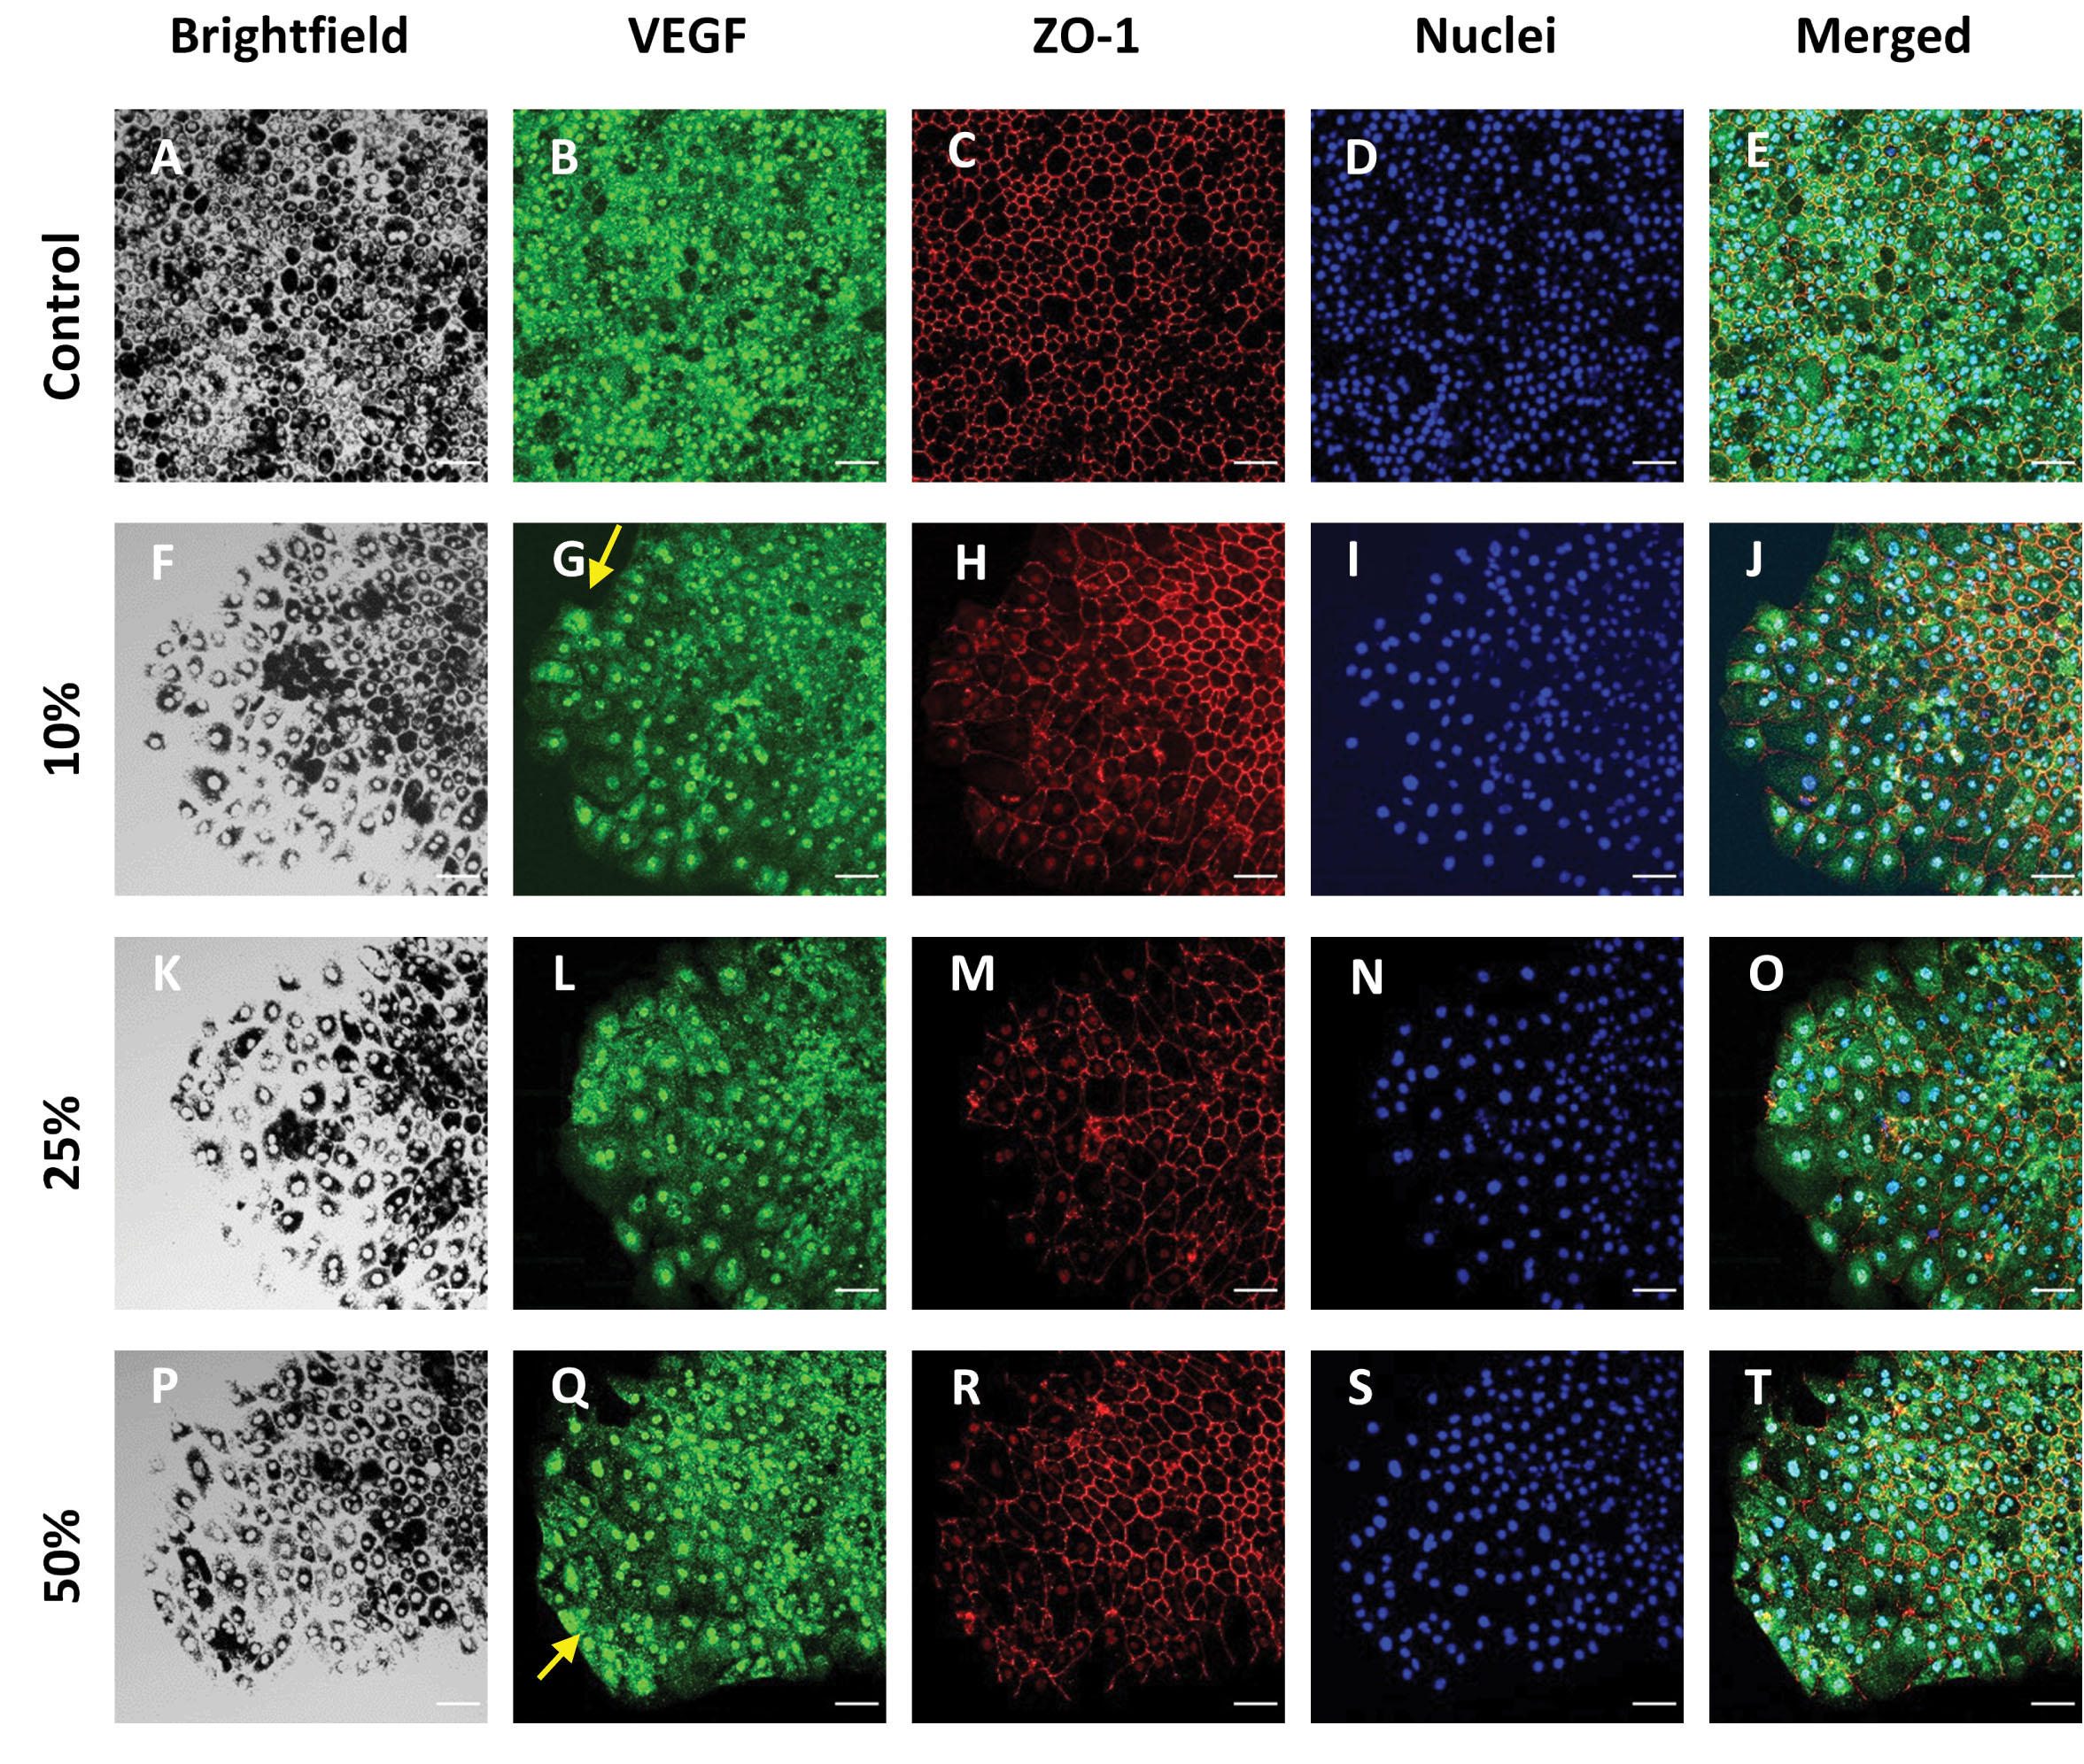
 Figure 4 of
Paterson, Mol Vis 2023; 29:87-101.
Figure 4 of
Paterson, Mol Vis 2023; 29:87-101.