Figure 3. Visualization of tight junction protein ZO-1 (red) and nuclei (blue) 1 day after stencil removal. A–D: Cells grown under normal
conditions exhibited the expected intercellular ZO-1 expression. E–H: Cells that experienced the removal of neighbors due
to a 10% stencil had fragmented ZO-1 localization. Scale bars: 50 µm.
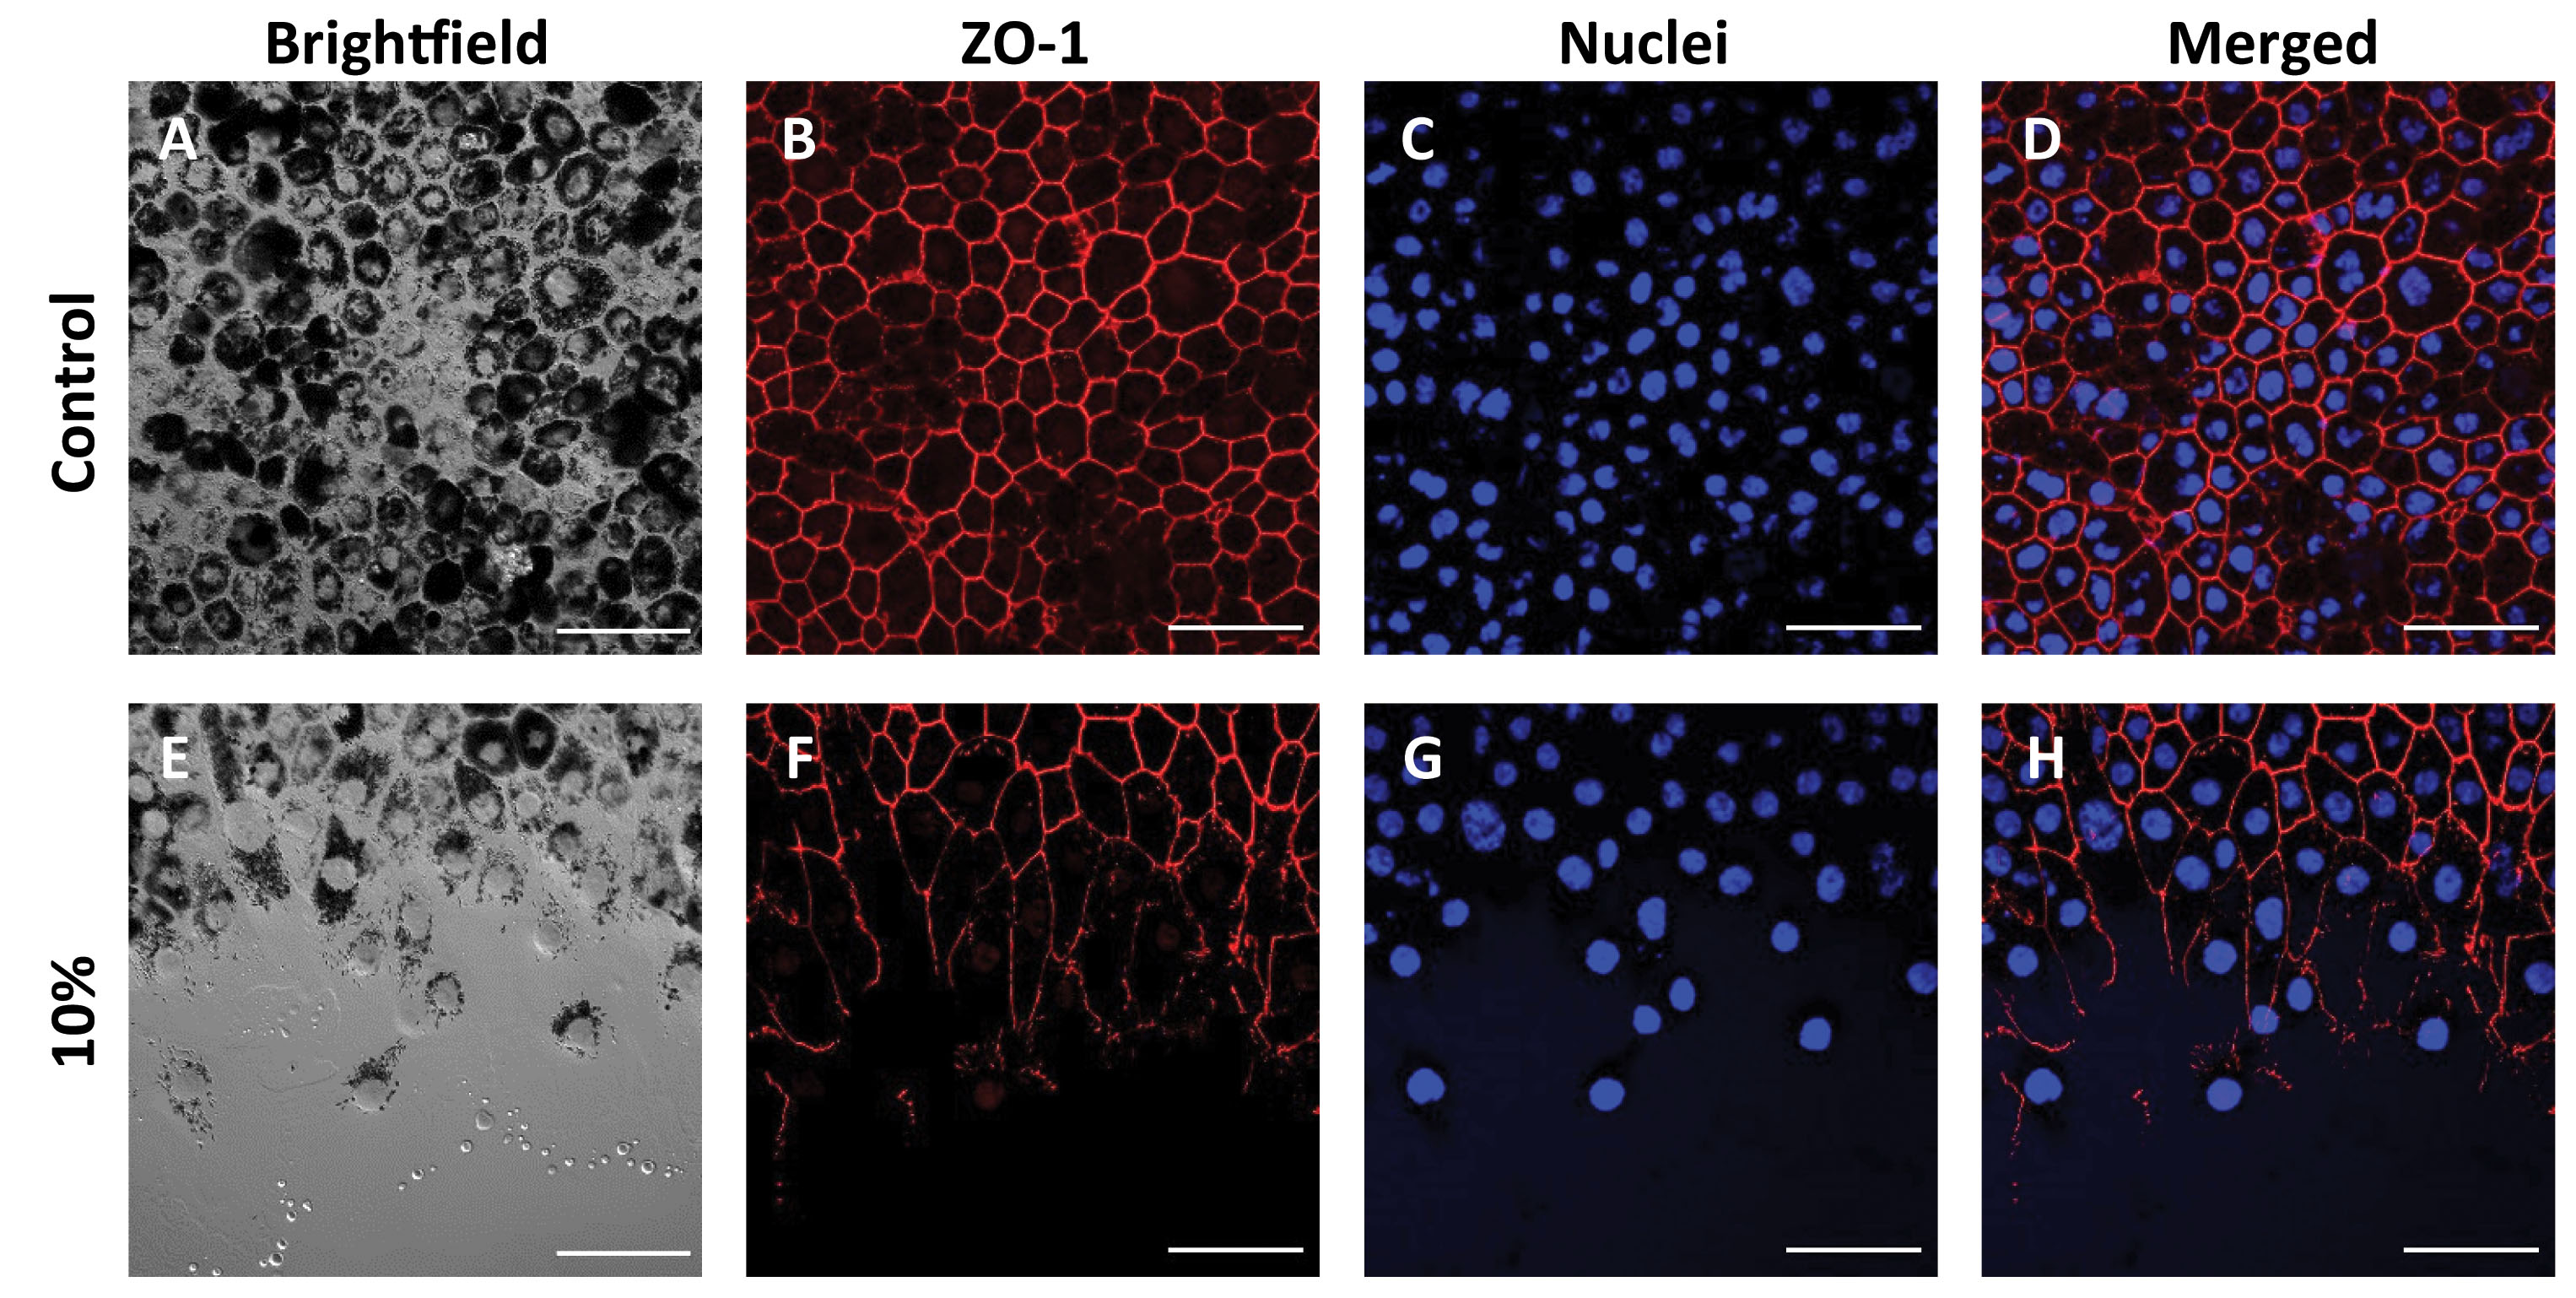
 Figure 3 of
Paterson, Mol Vis 2023; 29:87-101.
Figure 3 of
Paterson, Mol Vis 2023; 29:87-101.