Figure 2. Images showing an overview of RPE cell growth before and after stencil removal. A: Image of a micropatterned stencil to mimic
25% detachment. B: Bright-field images of the stencil effectively controlling RPE cell growth. C: Immediately after the stencil
was removed, the monolayer maintained the shape of the stencil. D: One day after stencil removal, the cells grew into the
empty space and experienced morphological changes and pigment loss. Scale bars: 5 mm (A) and 100 μm (B–D).
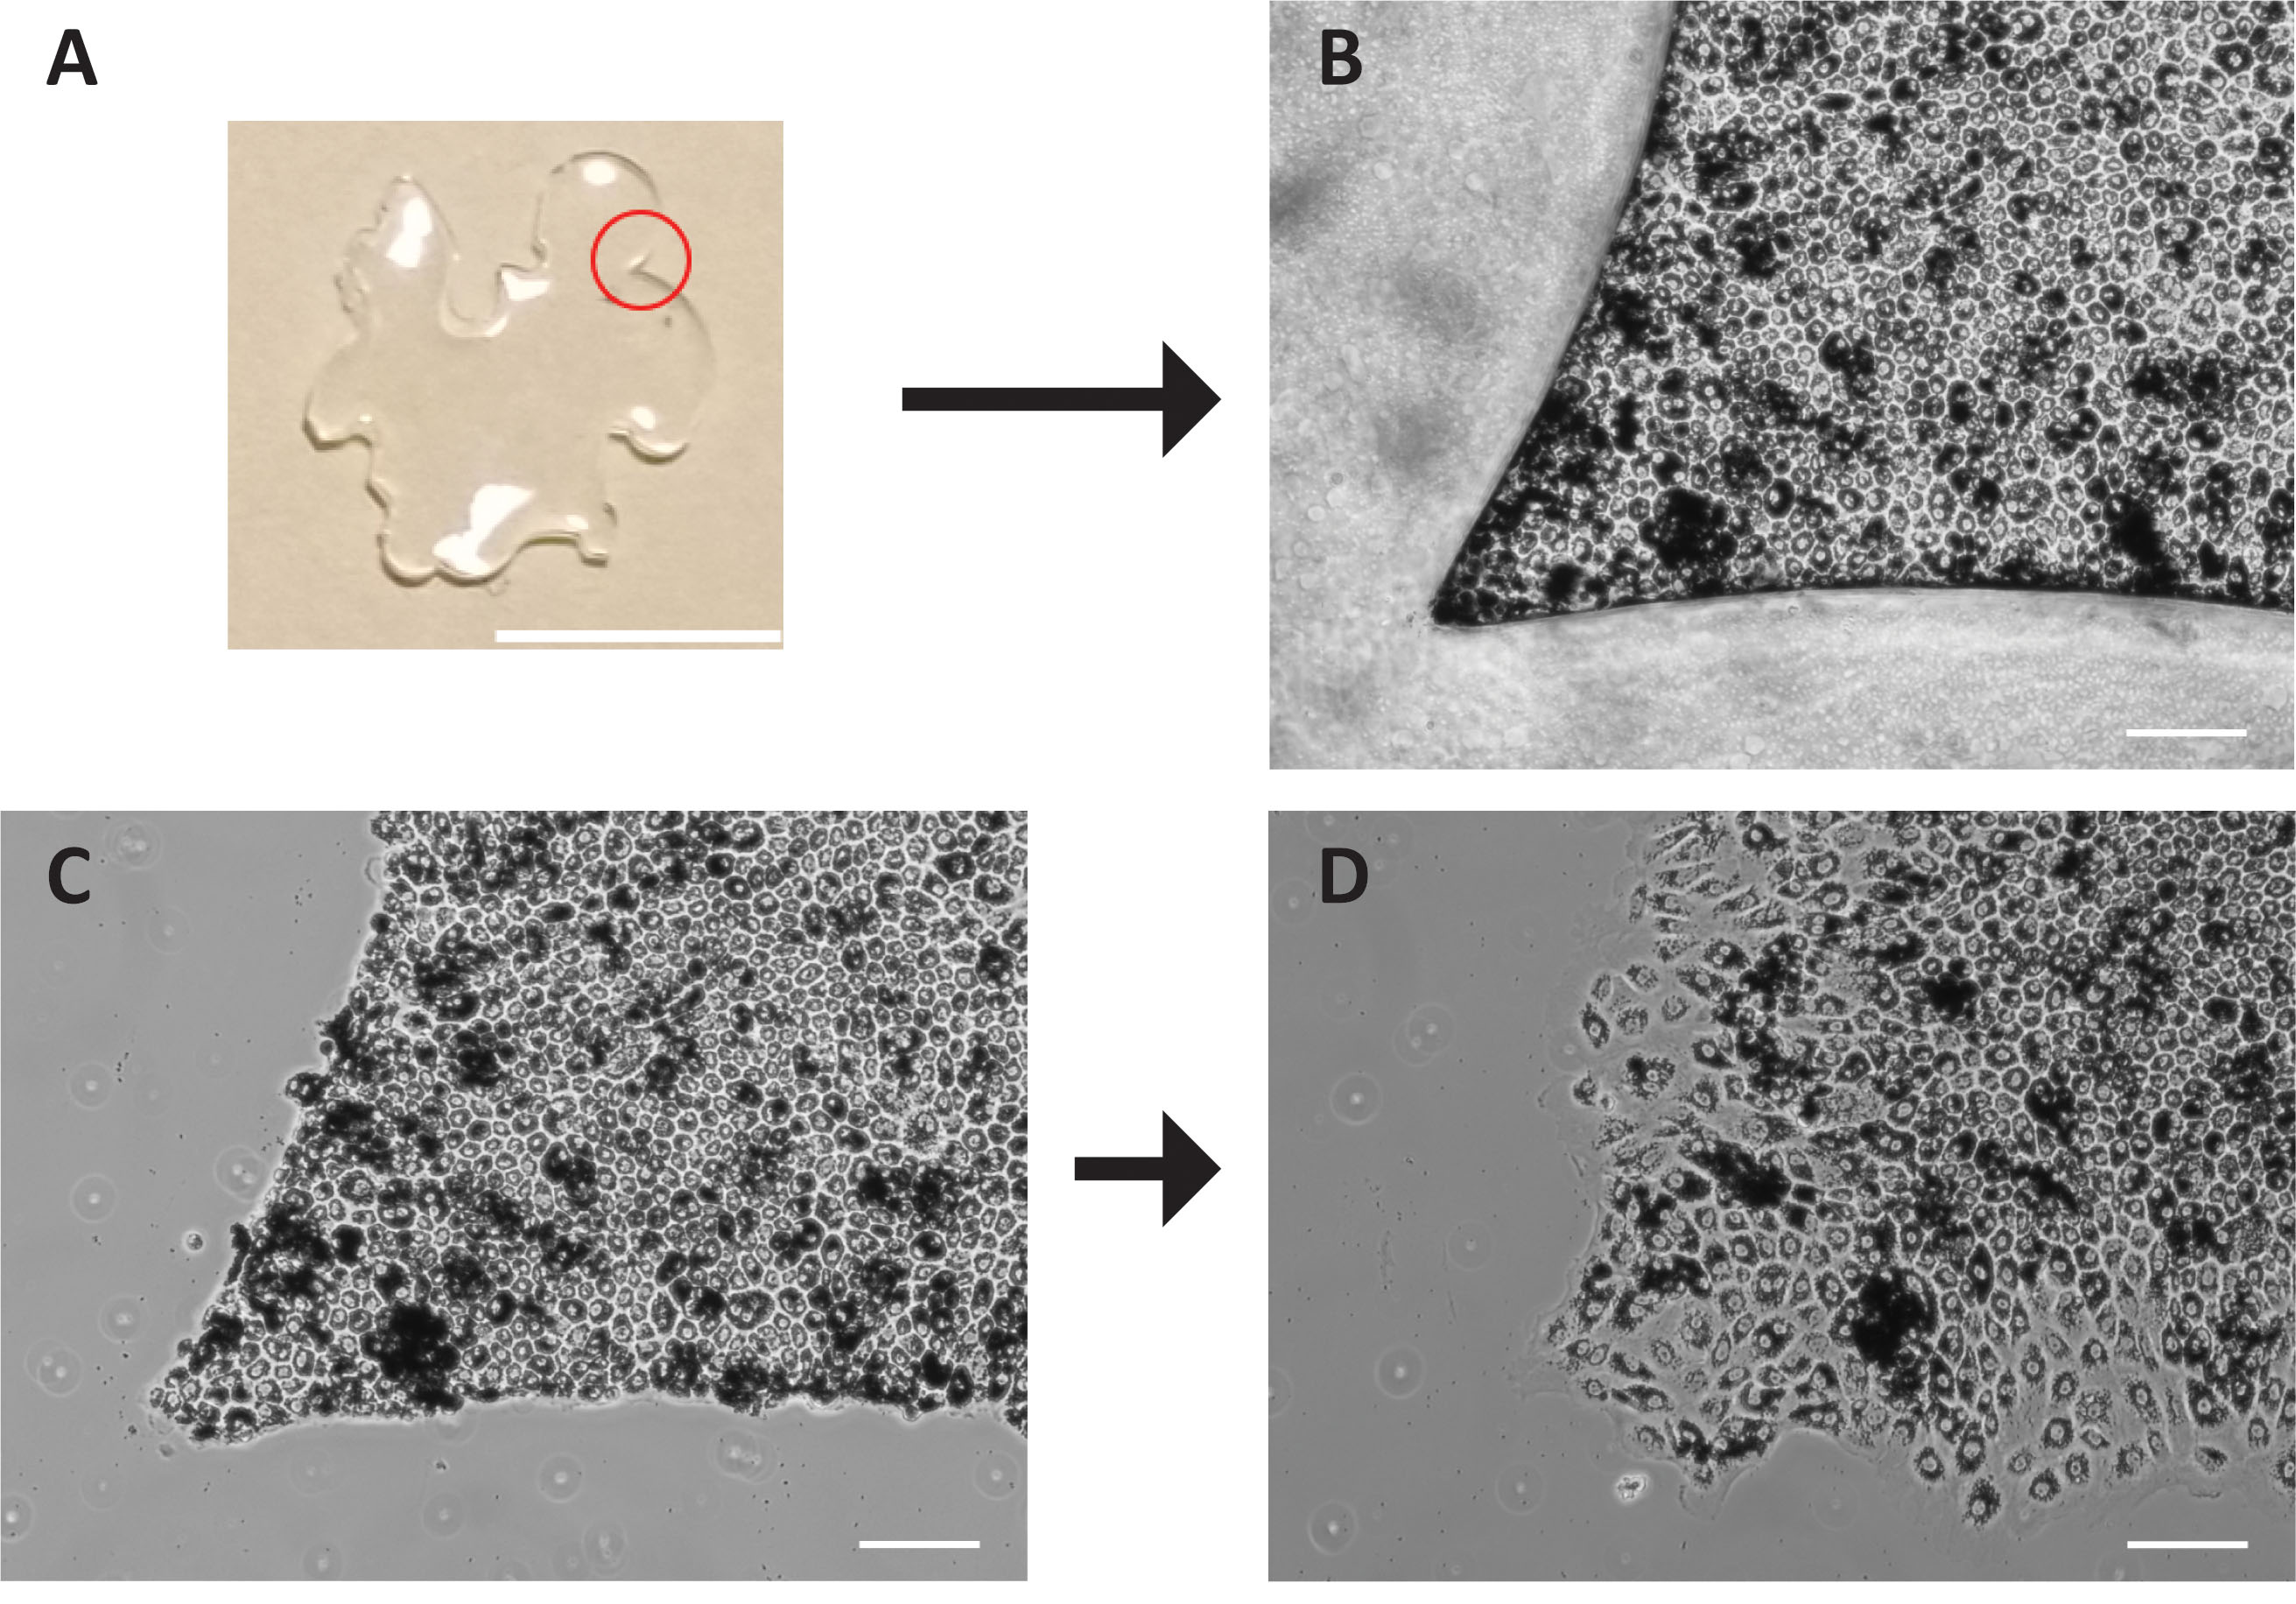
 Figure 2 of
Paterson, Mol Vis 2023; 29:87-101.
Figure 2 of
Paterson, Mol Vis 2023; 29:87-101.