Figure 3. Silver-intensified immunogold staining for glutamate in 6-week and 9-month-old WT and xCT KO retinas. (A–D) Representative
images of glutamate immunoreactivity in the 6-week WT (A) and xCT KO (C) retinas, and 9-month WT (B) and xCT KO (D) retinas.
The dark arrows in (A) and (C) indicate Müller cells; the thinner arrows in (A) are examples of BP cells (BC), amacrine cells
(AC), and ganglion cells (GC); and the individual arrowheads indicate the location of the Müller cell endfeet. Scale bar =
50 µm. Insets show magnified views of the outer nuclear layer (A'-D'), inner nuclear layer (A″–D″), and ganglion cell layer
(A*–D*). The cell types identified in these views include the photoreceptor cell bodies (PR), BC, Müller cell bodies (MC),
AC, and the Müller cell endfeet (MCef). (E and F) Quantitative analysis of glutamate in each retinal layer expressed as the
percentage change in amino acid immunoreactivity of the 6-week xCT KO (C) or 9-month xCT KO (D) retinas in comparison with
the age-matched WT retinas, whereby a change of 1 represents a 100% change in labeling intensity. OS=photoreceptor outer segments;
IS=photoreceptor inner segments; ONL=outer nuclear layer; OPL=outer plexiform layer; INL=inner nuclear layer; IPL=inner plexiform
layer; GCL=ganglion cell layer. n = 6 retinas. *p < 0.05, **p < 0.01.
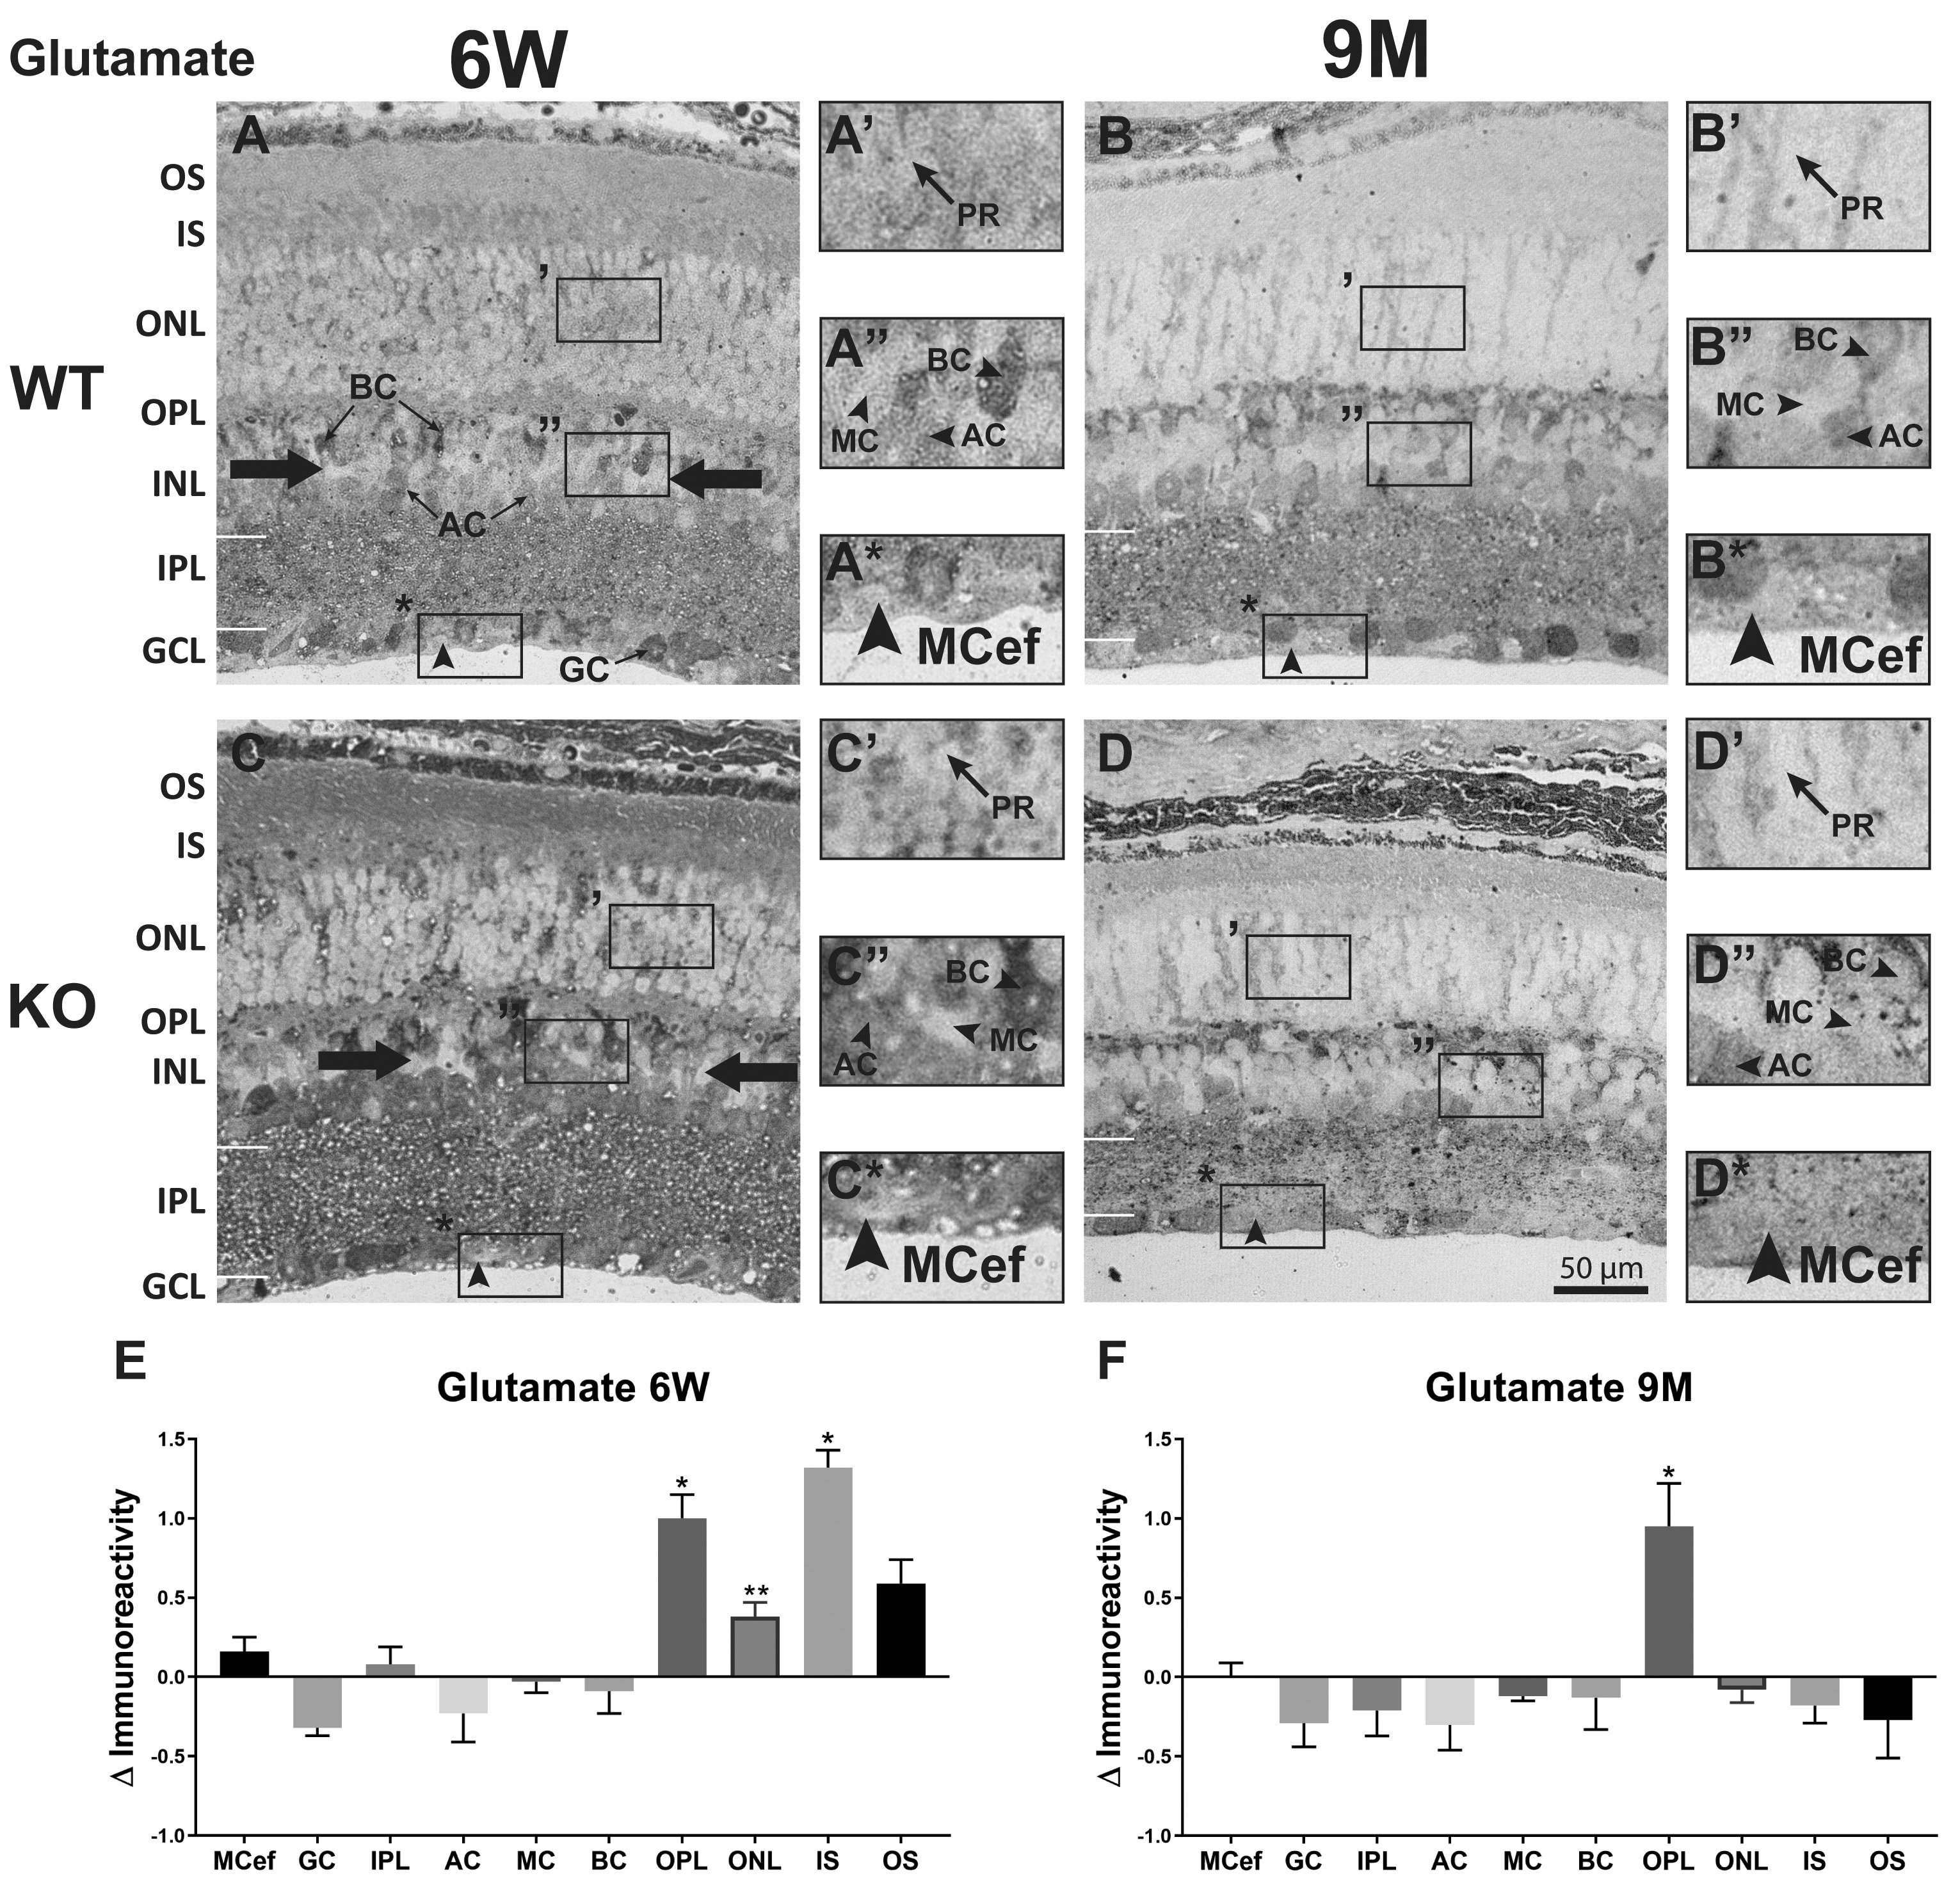
 Figure 3 of
Knight, Mol Vis 2023; 29:274-xxx.
Figure 3 of
Knight, Mol Vis 2023; 29:274-xxx.