Figure 3 of
Kurt, Mol Vis 2023; 29:245-255.
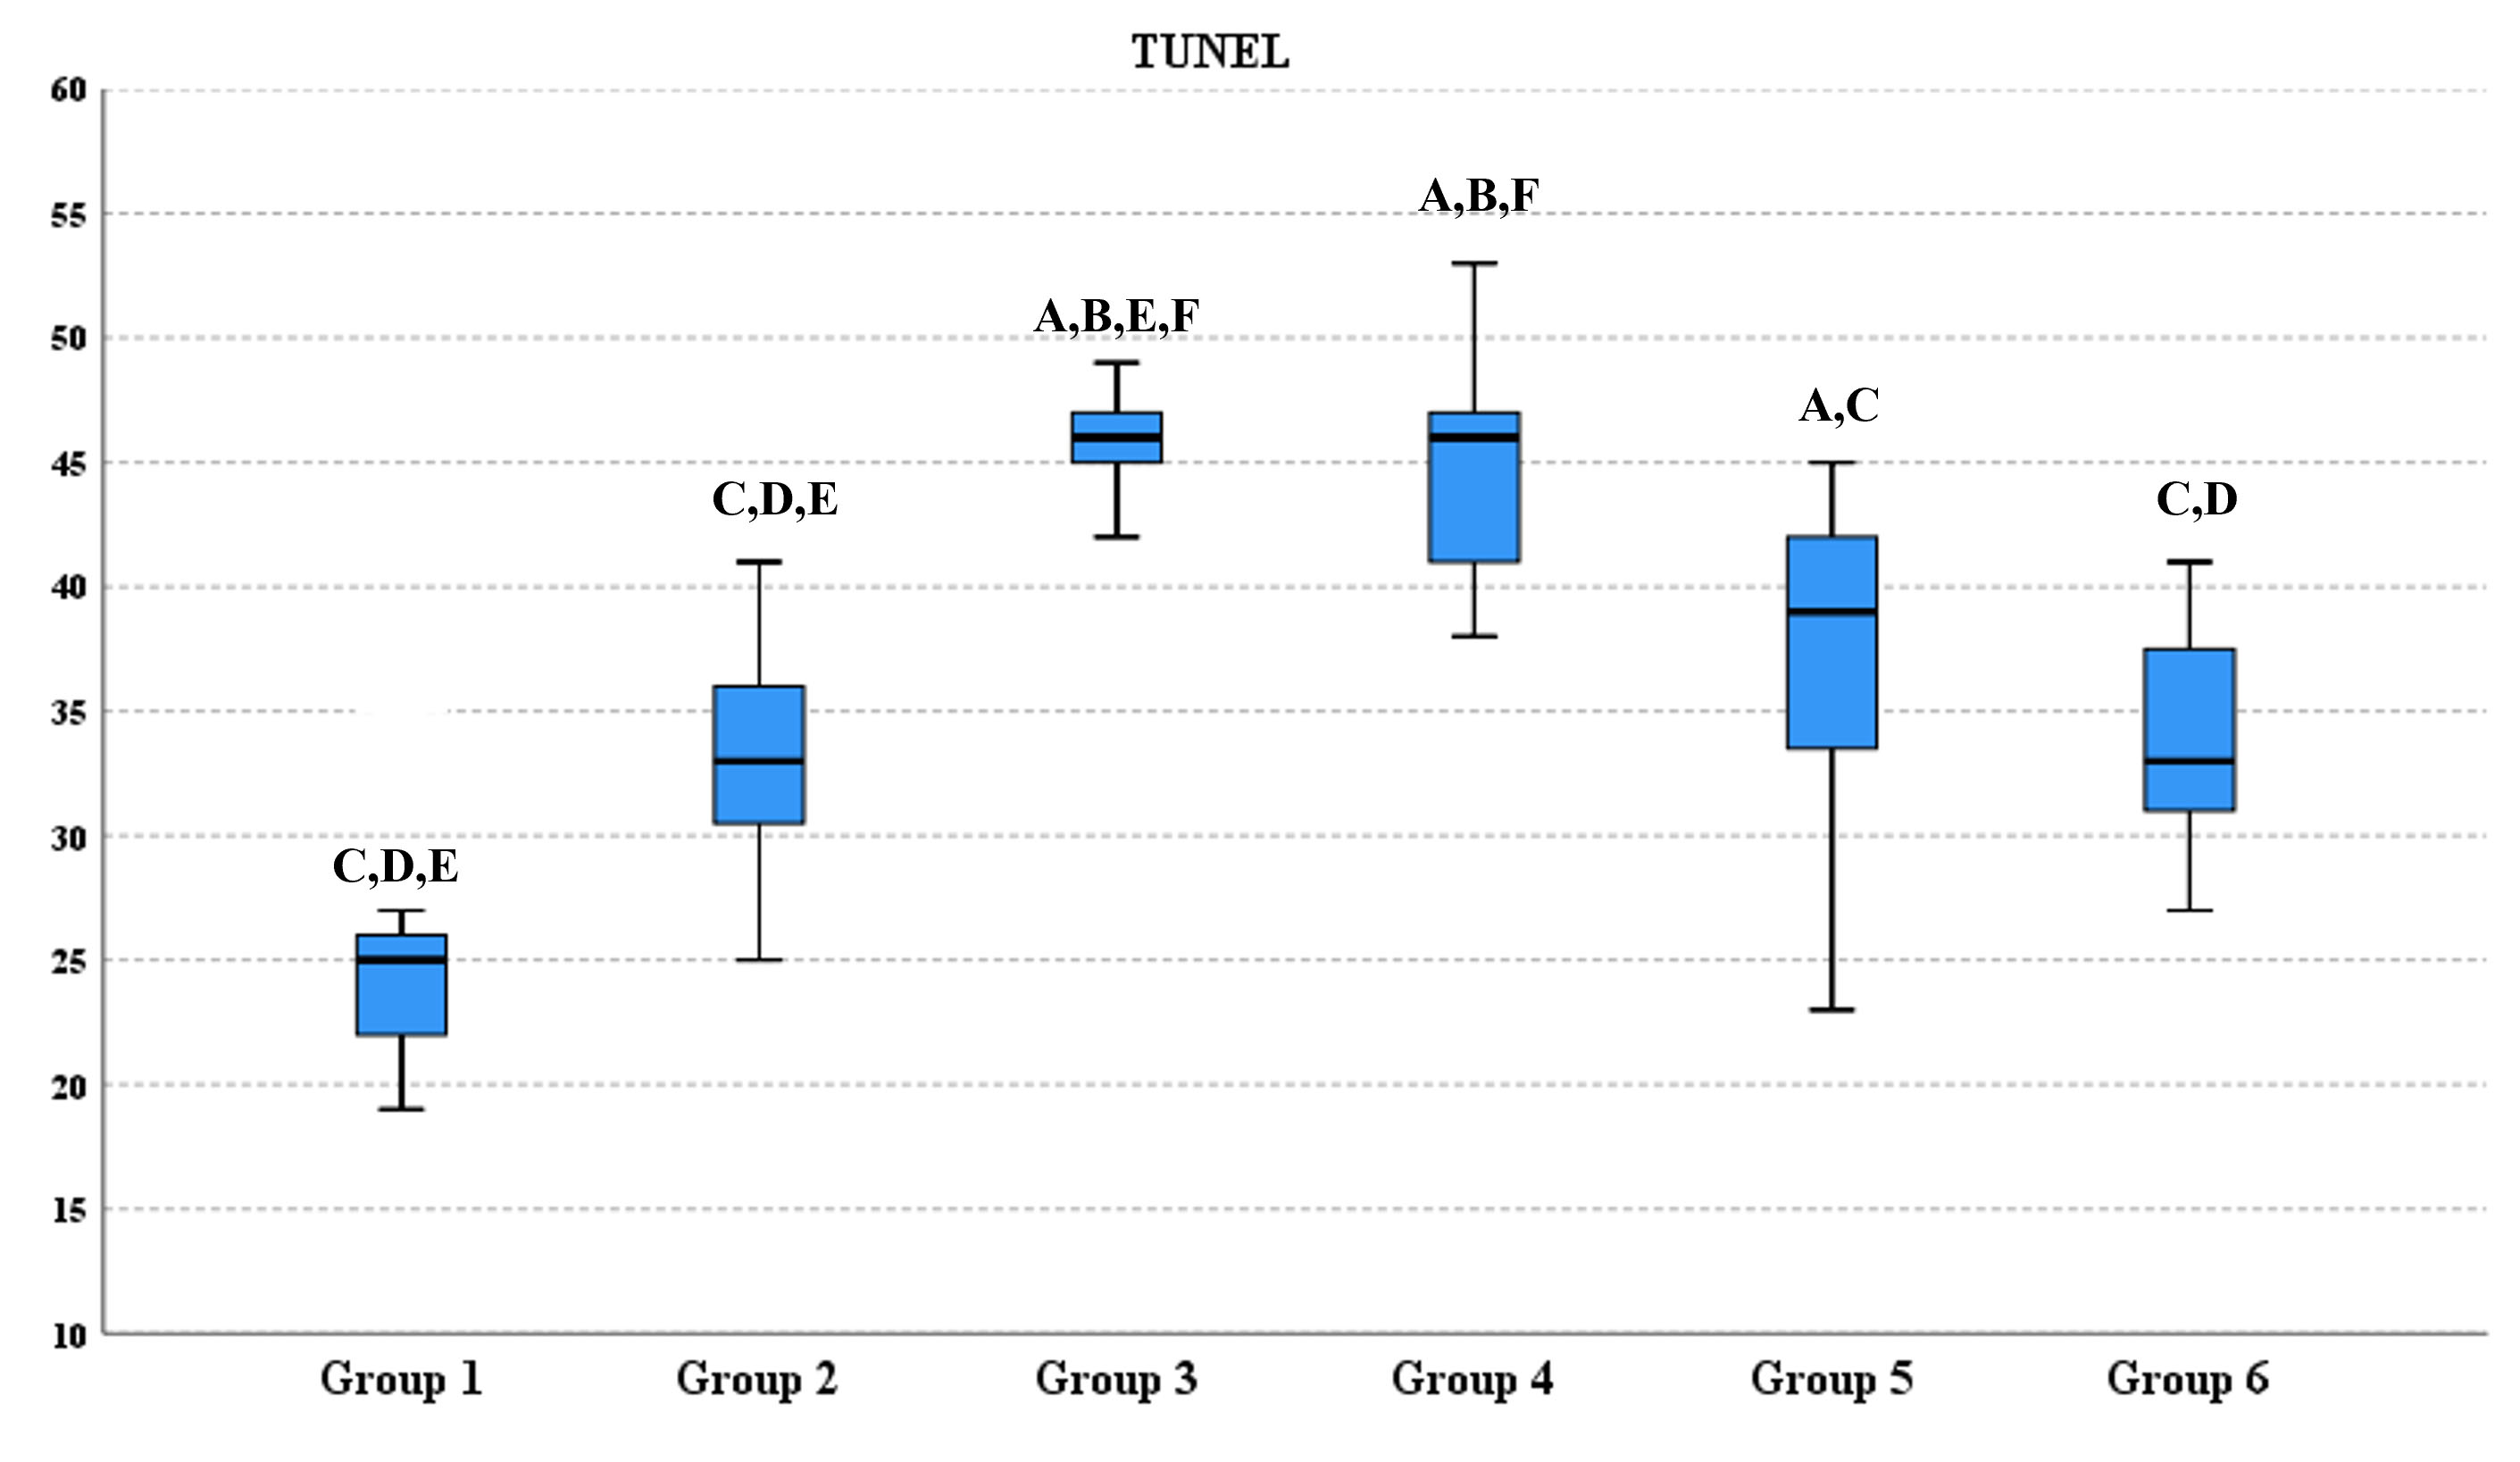
Figure 3.
TUNEL results of all groups (number of TUNEL-positive cells/total cells). There is a statistically significant difference when compared with A) Group 1, B) Group 2, C) Group 3, D) Group 4, E) Group 5, and F) Group 6 (p<0.05).
 Figure 3 of
Kurt, Mol Vis 2023; 29:245-255.
Figure 3 of
Kurt, Mol Vis 2023; 29:245-255.