Figure 3. Coomassie blue staining of VH from CTRL and LD mice. (A) The VH samples were collected from CTRL and LD mouse eyes. For each
line, an equal volume of VH (2.5 μl) was loaded. (B) The heatmap shows the protein band intensity within the indicated molecular
weight ranges. n = 2 eyes per sample. The band intensity was measured using ImageJ.
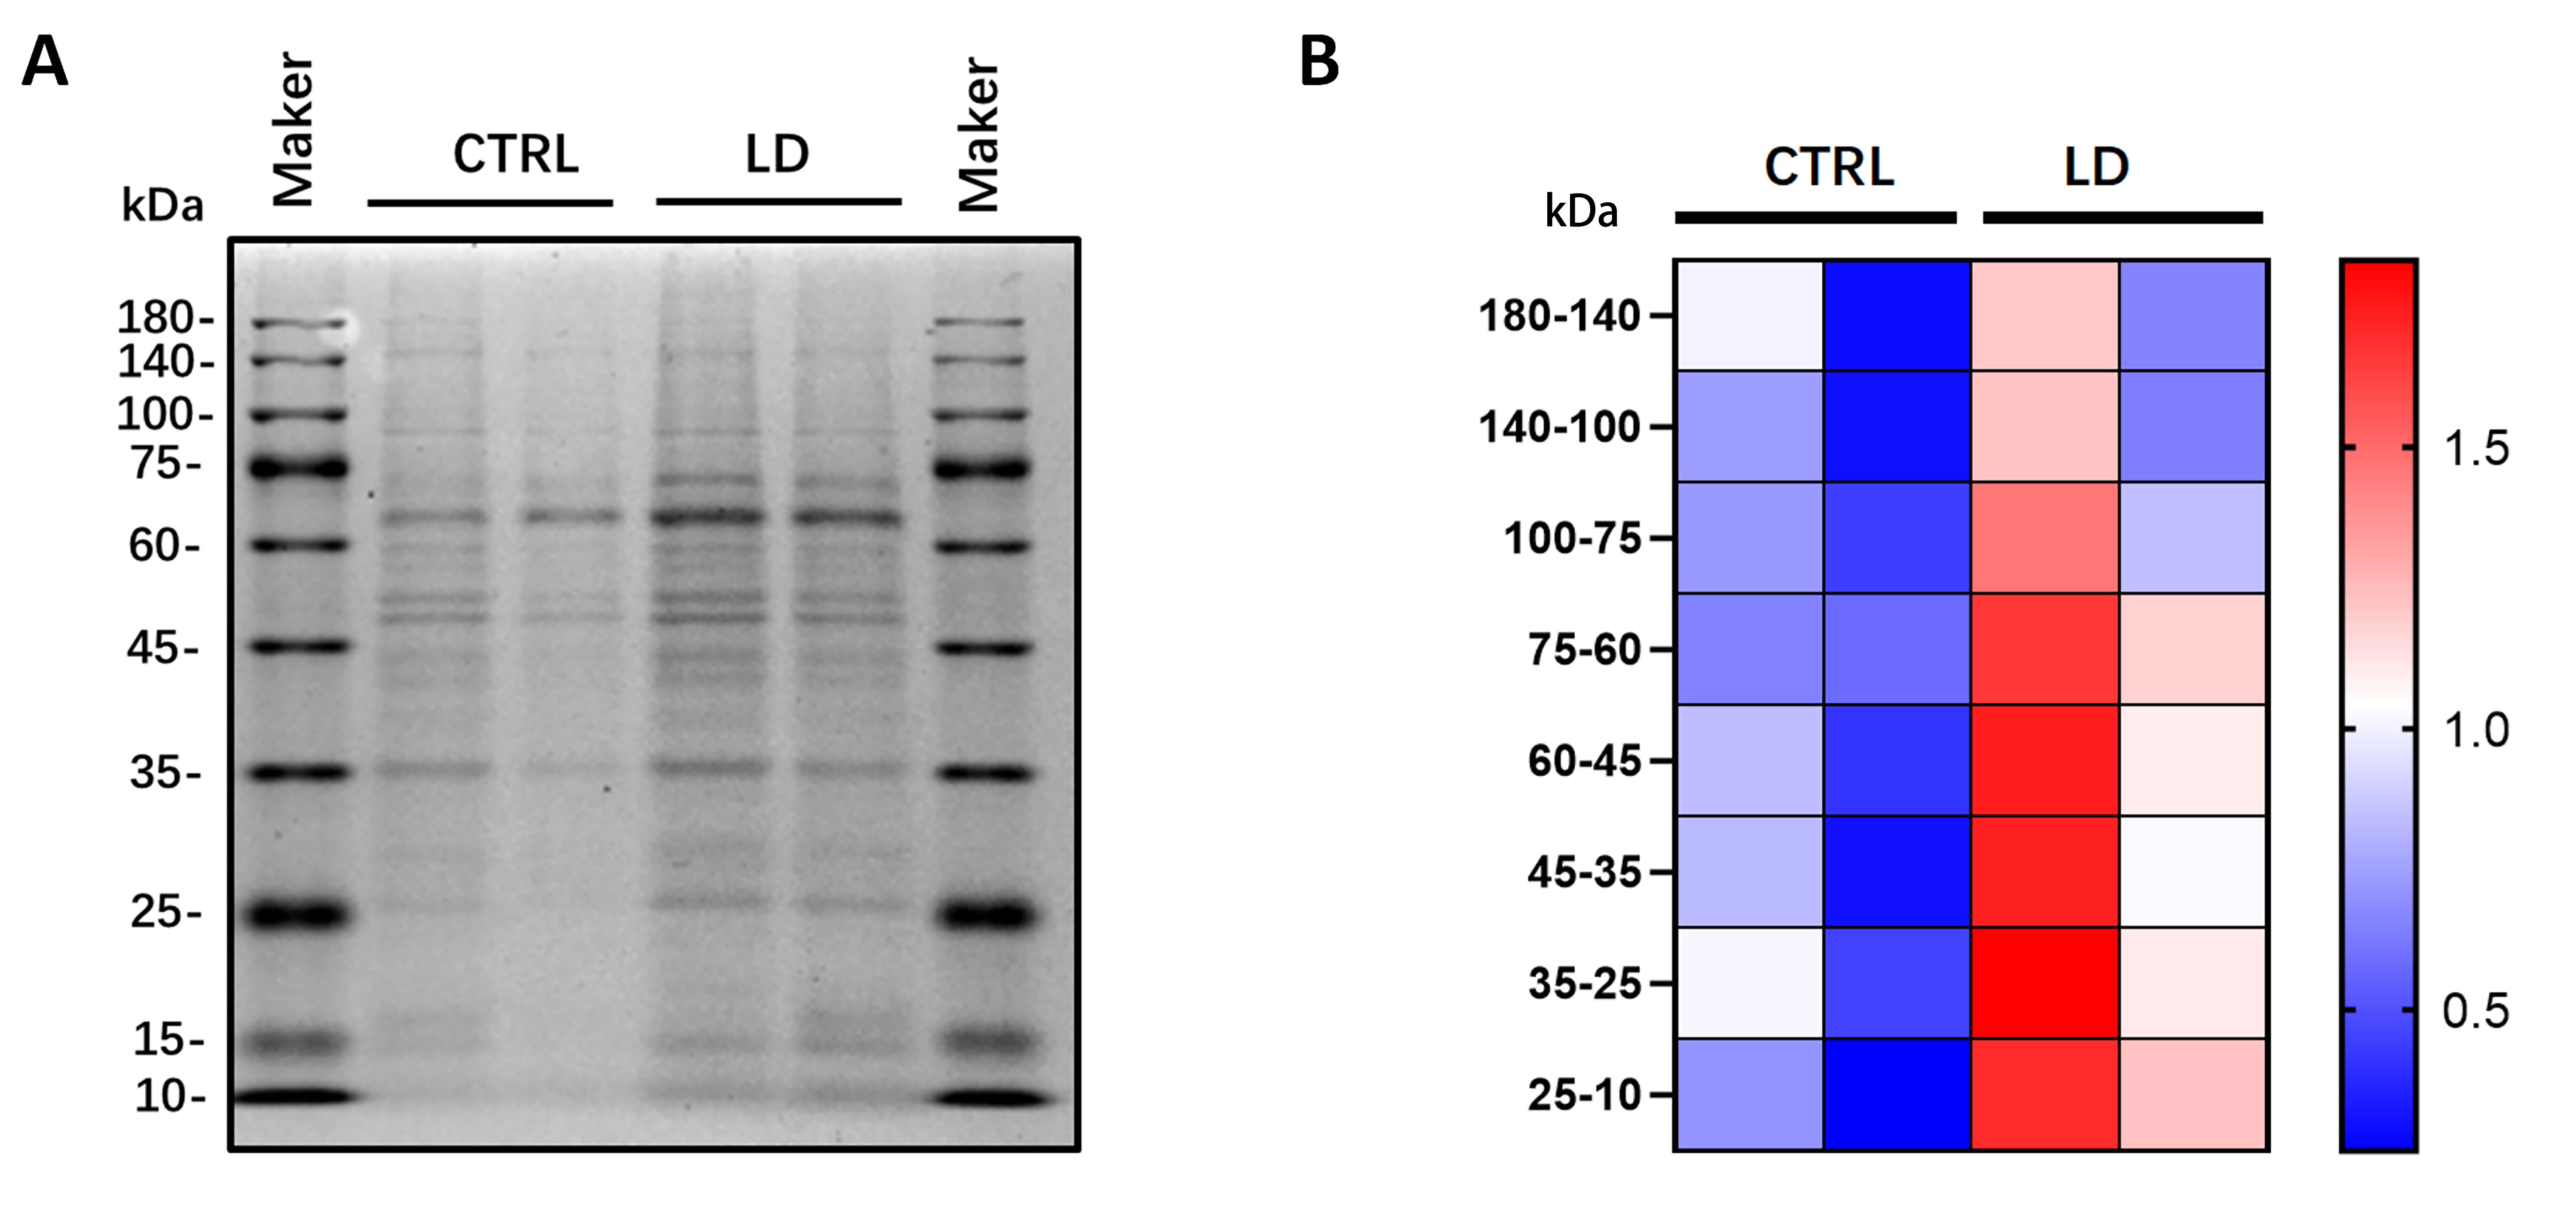
 Figure 3 of
Liu, Mol Vis 2023; 29:180-187.
Figure 3 of
Liu, Mol Vis 2023; 29:180-187.