Figure 2. Light damage (LD) induces retinal inflammation and infiltration of microglia/macrophages into the outer nuclear layer (ONL).
A: A heatmap shows genes for positive regulation of inflammatory response in control (CTRL) and LD mouse retinas. n = 4 mice
per group. B: Gene set enrichment analysis (GSEA) analysis of the positive regulation of the inflammatory response in response to LD (p.
adjust = 4.222e-09). C: Immunofluorescence analysis shows IBA1-positive microglia/macrophages. Note that LD induces the migration of IBA1-positive
cells to the ONL layer. Right panel: quantification of IBA1-positive cells in ONL. The IBA1-positive cell number was divided
by the ONL area (region indicated by dashed lines) using ImageJ. Six regions from four retinas were randomly selected for
quantification. Scale bar: upper panel: 50 μm; lower panel: 10 μm. Unpaired t-test, n = 4 eyes per group.
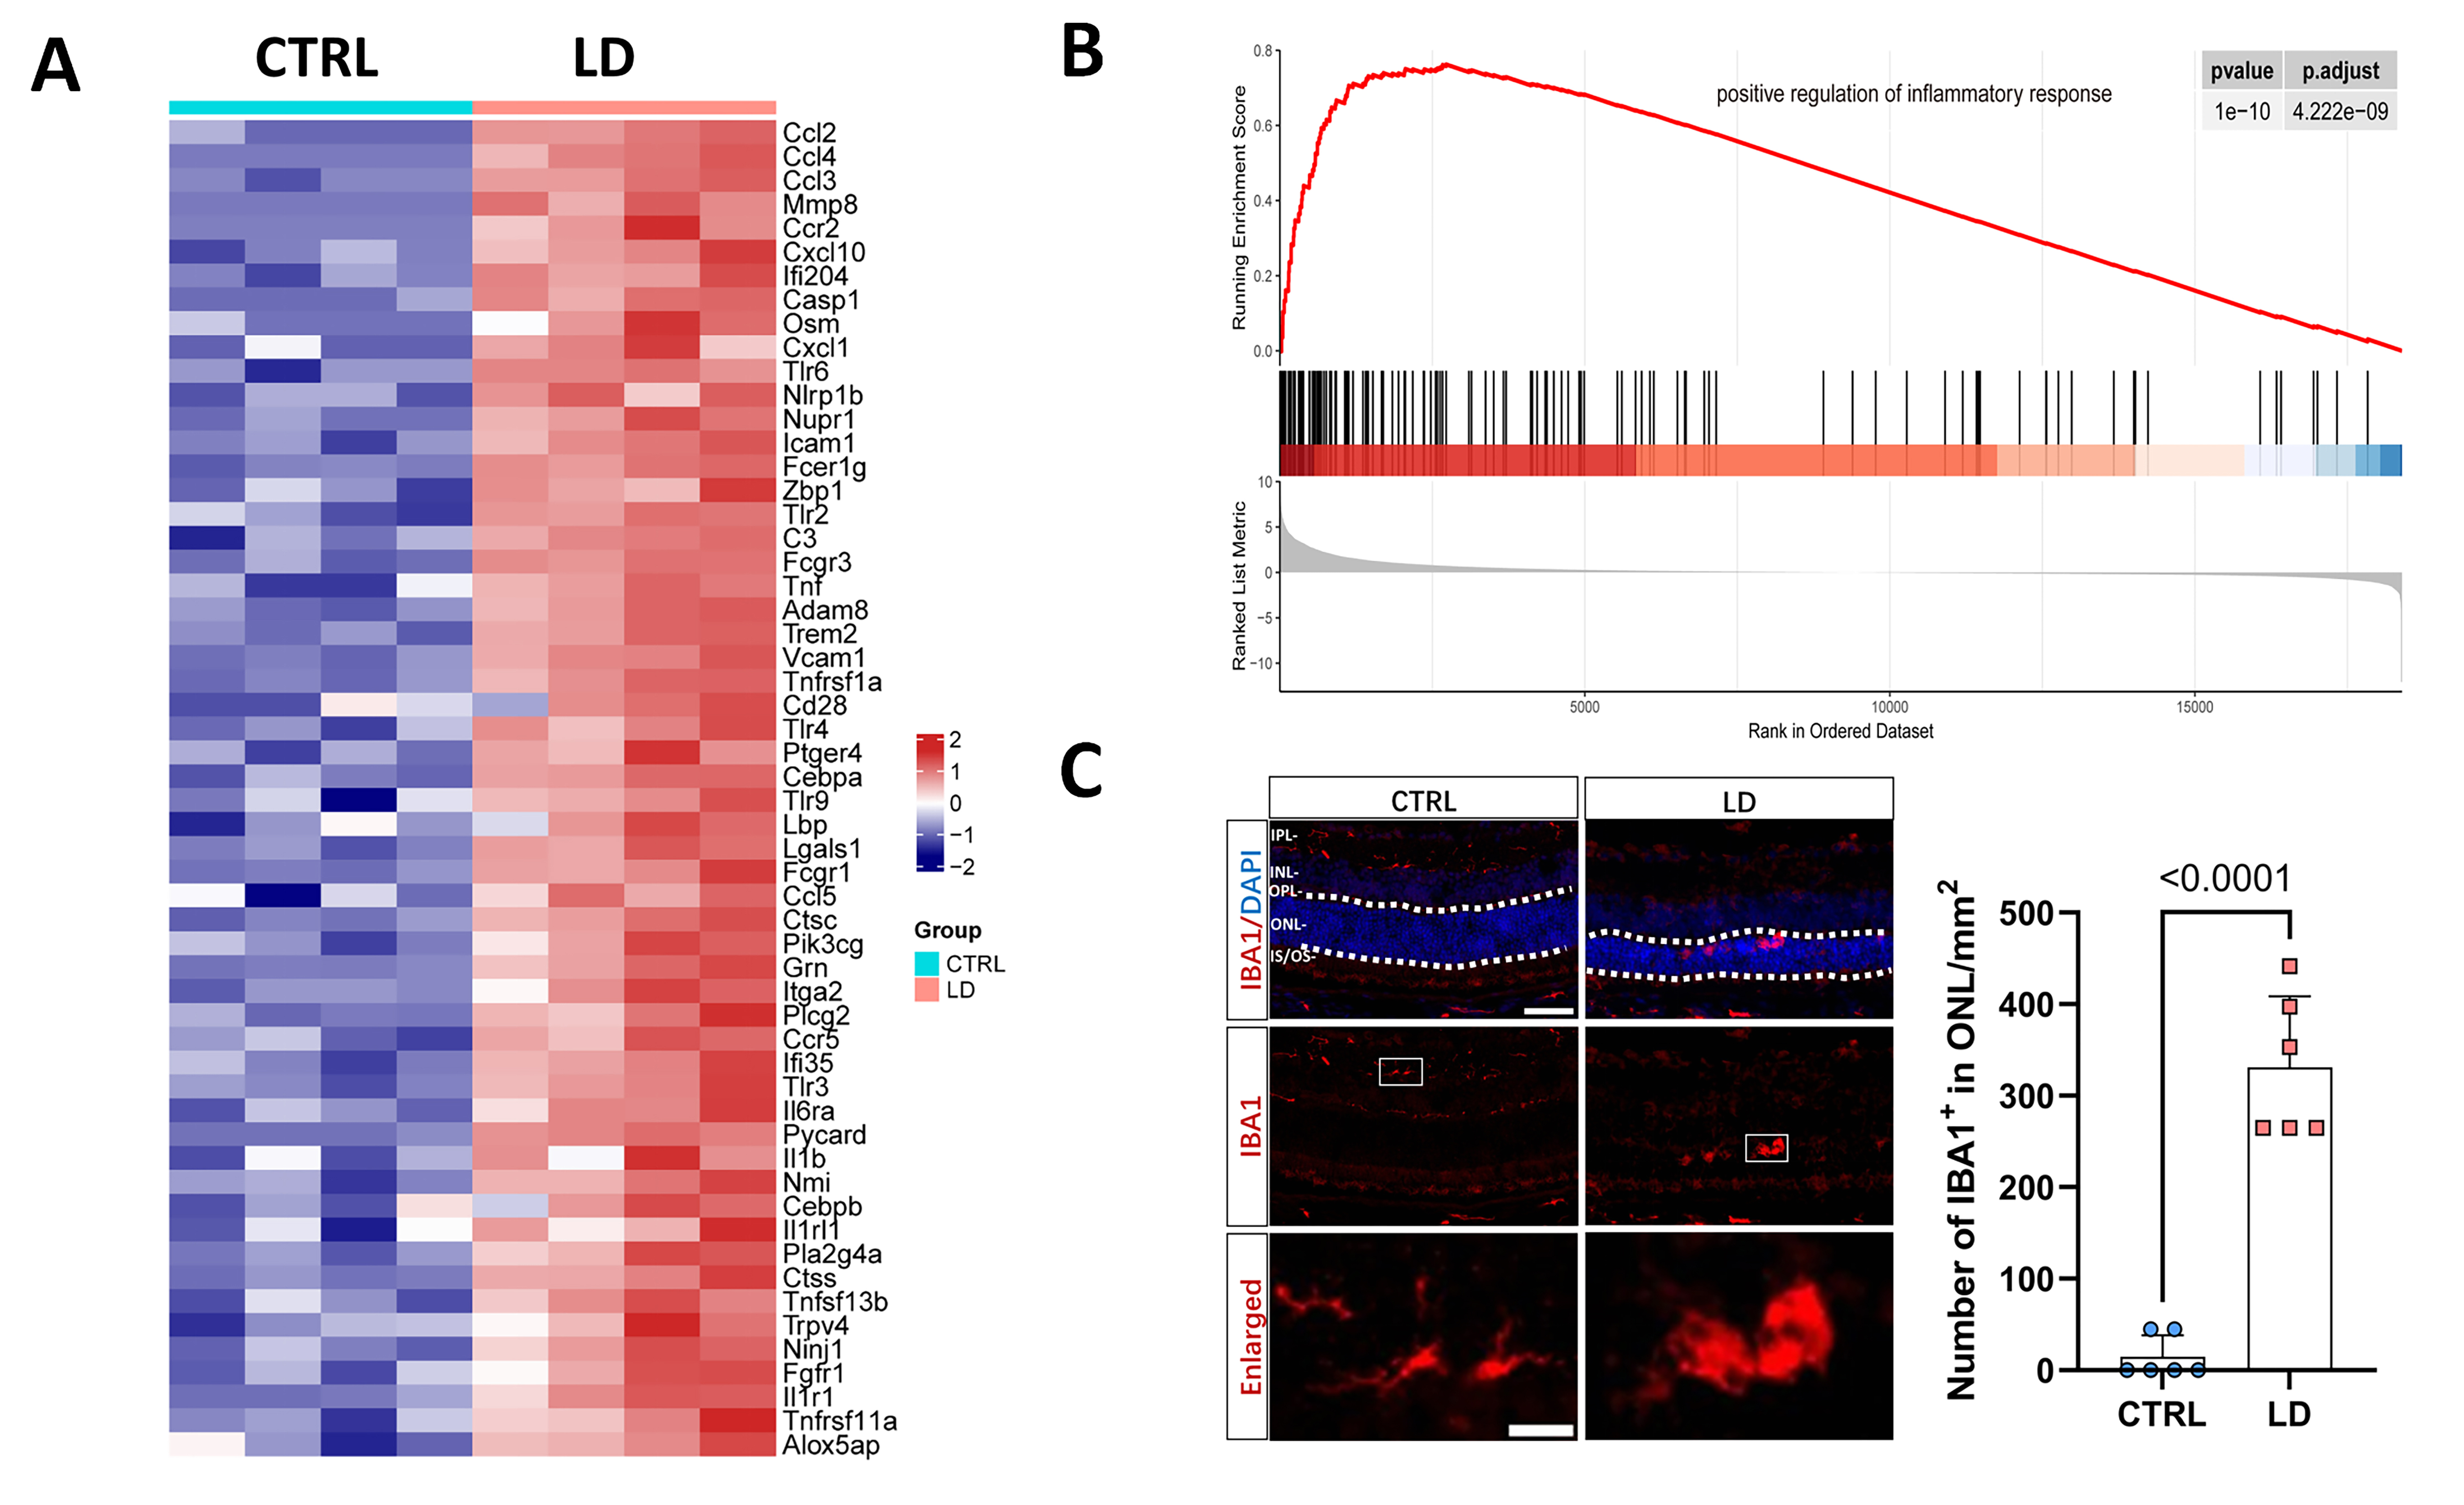
 Figure 2 of
Liu, Mol Vis 2023; 29:180-187.
Figure 2 of
Liu, Mol Vis 2023; 29:180-187.