Figure 1. LD leads to retinal degeneration and photoreceptor death. The mice were exposed to typical laboratory lighting (50 lx) or
white light (15,000 lx) for 2 h, and analyses were performed two days after LD. A: In vivo OCT shows retina structure in control (CTRL) and light-exposed (LD) mice. LD induces an altered reflectance in the
outer nuclear layer (ONL); n = 5 mice per group. B: HE staining shows retina structure in CTRL and LD mice. Scale bar: upper panel: 200 μm, lower panel: 50 μm. GCL: ganglion
cell layer; IPL: inner plexiform layer; INL: inner nuclear layer; OPL: outer plexiform layer; ONL: outer nuclear layer; IS:
inner segment; OS: outer segment; n = 3 mice per group. C: TUNEL assay shows cell viability in CTRL and LD mouse retinas. Note that LD causes massive cell death in photoreceptors
(red signals), but no detectable cell death occurs in other retinal layers. Scale bar: upper panel: 200 μm, lower panel: 50
μm. The right panel shows the quantification results of TUNEL. The TUNEL signal was quantified by dividing the fluorescence
intensity by the area of INL+OPL+ONL (region indicated by dashed lines) using ImageJ. Six regions from four retinas were randomly
selected for quantification. Unpaired t-test, n = 4 eyes per group. D: ERG response of mouse retina with the indicated treatment; n = 4–6 mice per group.
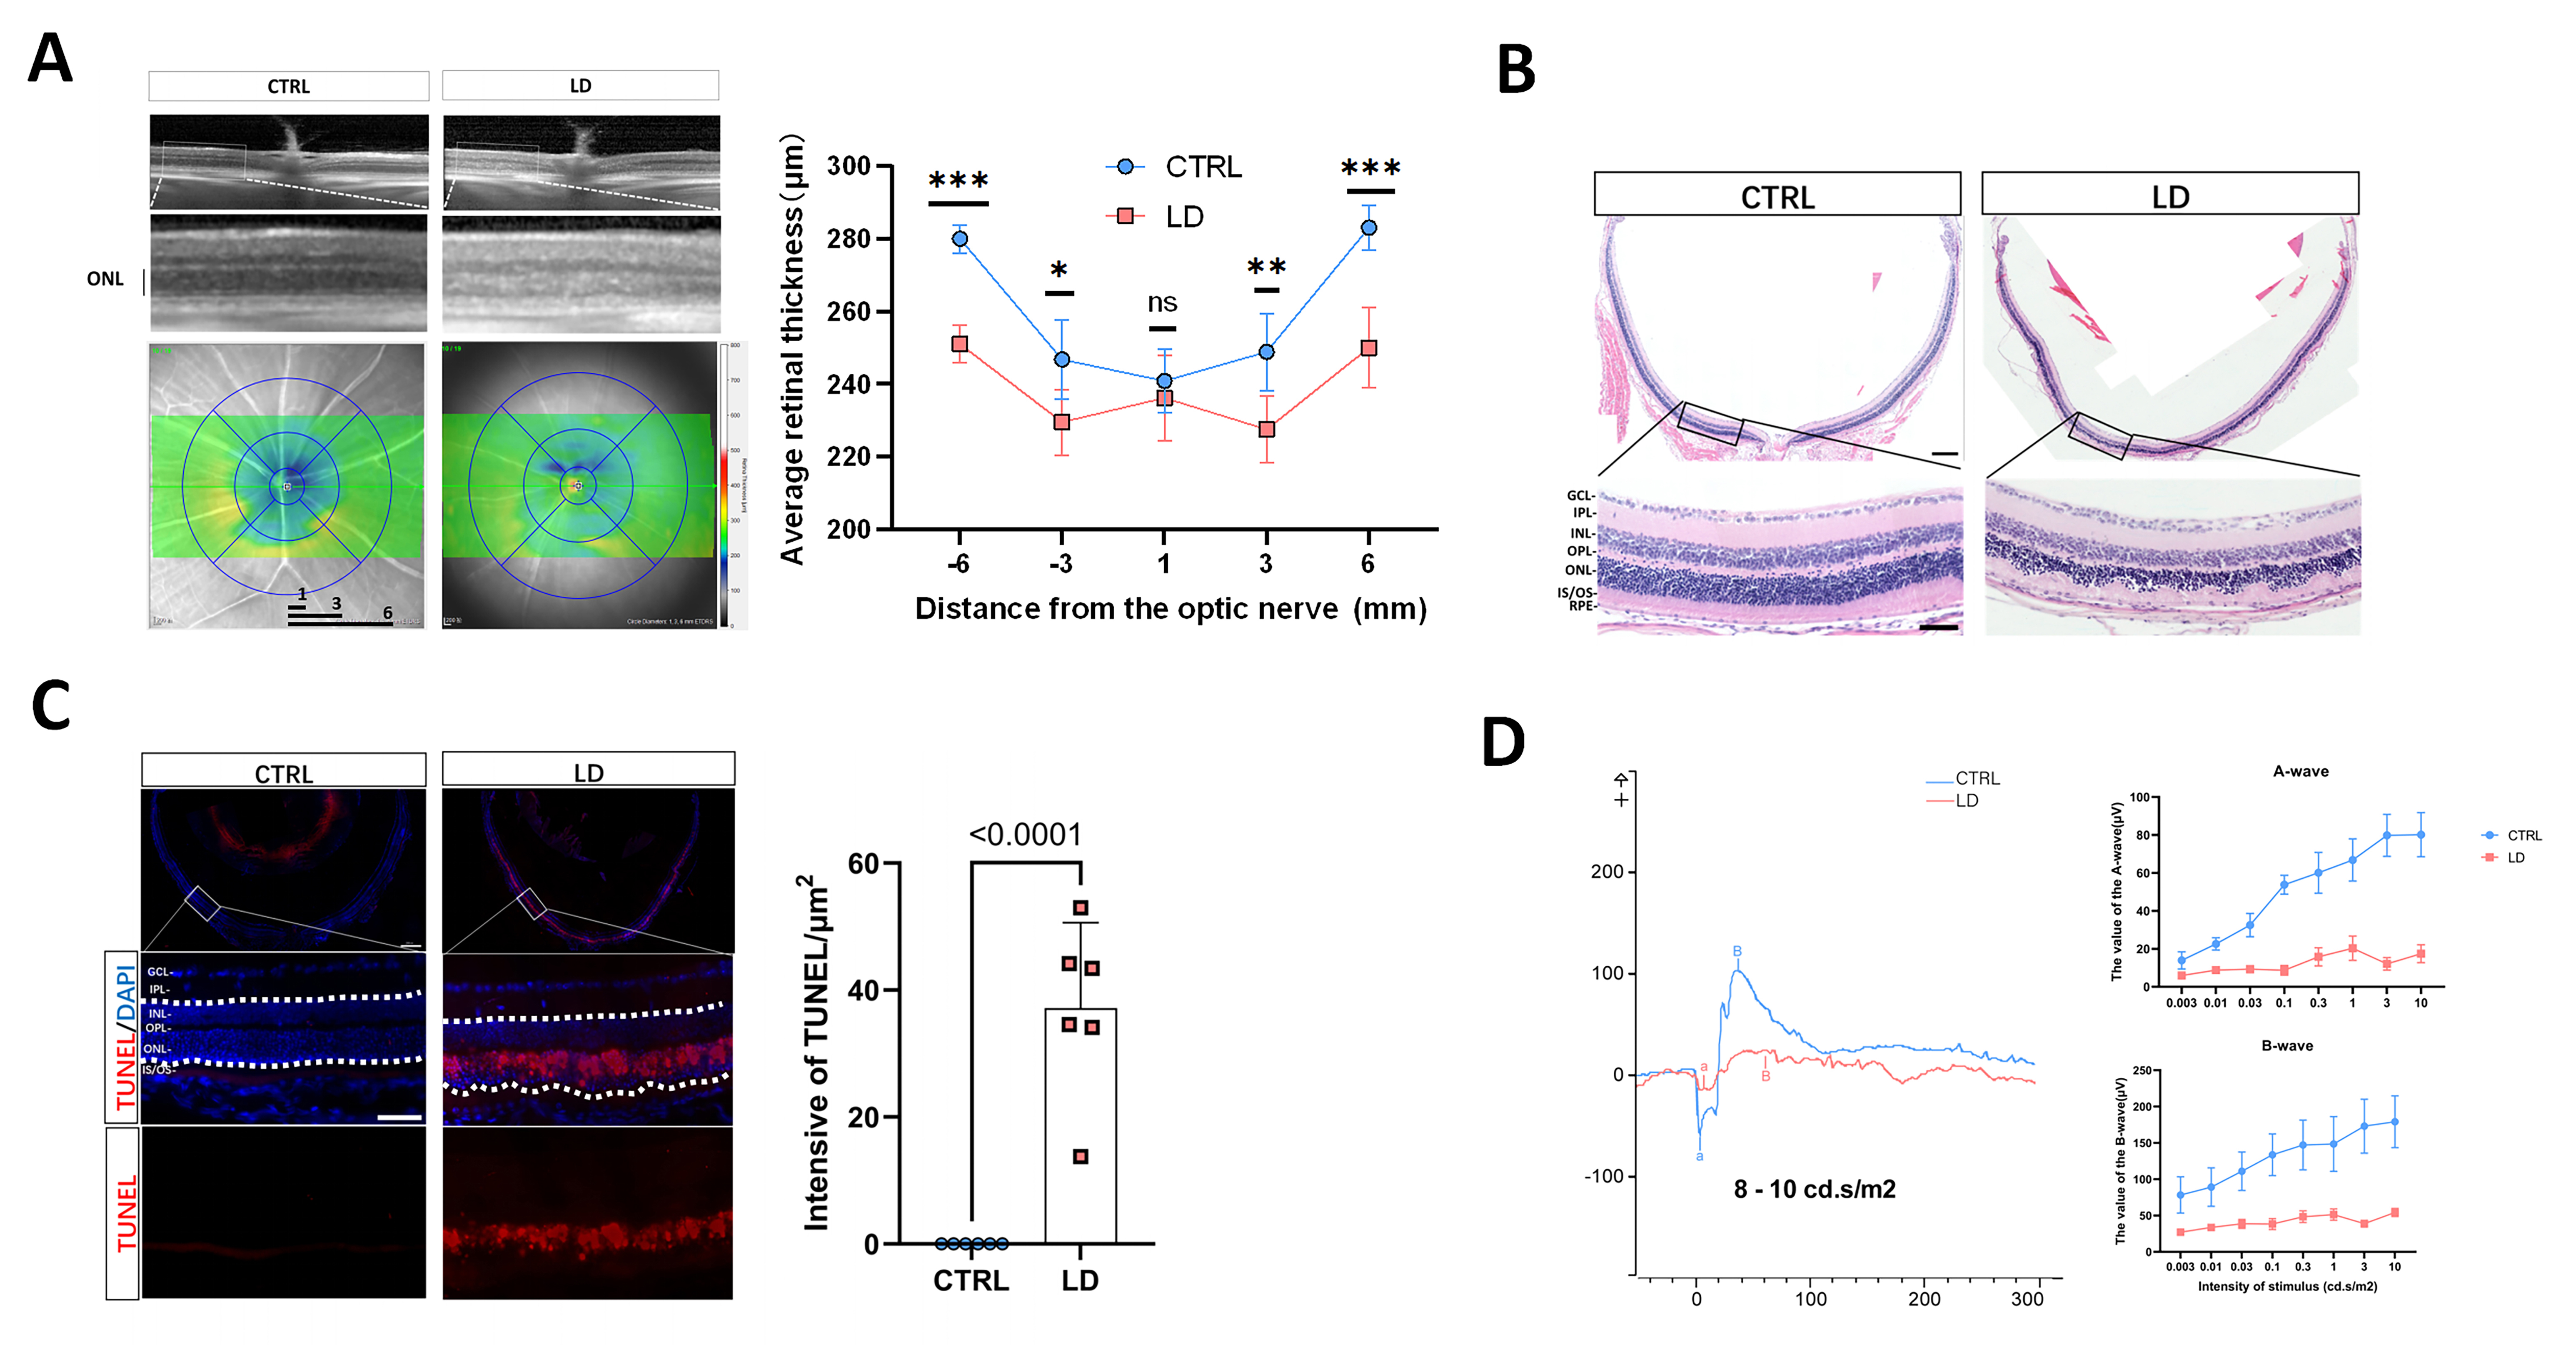
 Figure 1 of
Liu, Mol Vis 2023; 29:180-187.
Figure 1 of
Liu, Mol Vis 2023; 29:180-187.