Figure 3. Concentrations of IL-1β, IL-6, and TNF-α in the vitreous fluid of T2DM patients and non-diabetic controls (PDR, n = 26; NPDR, n = 26; NDR, n = 25; controls, n = 27). The comparison was made by the Kruskal–Wallis test with Dunn’s multiple comparison test. *p < 0.001.
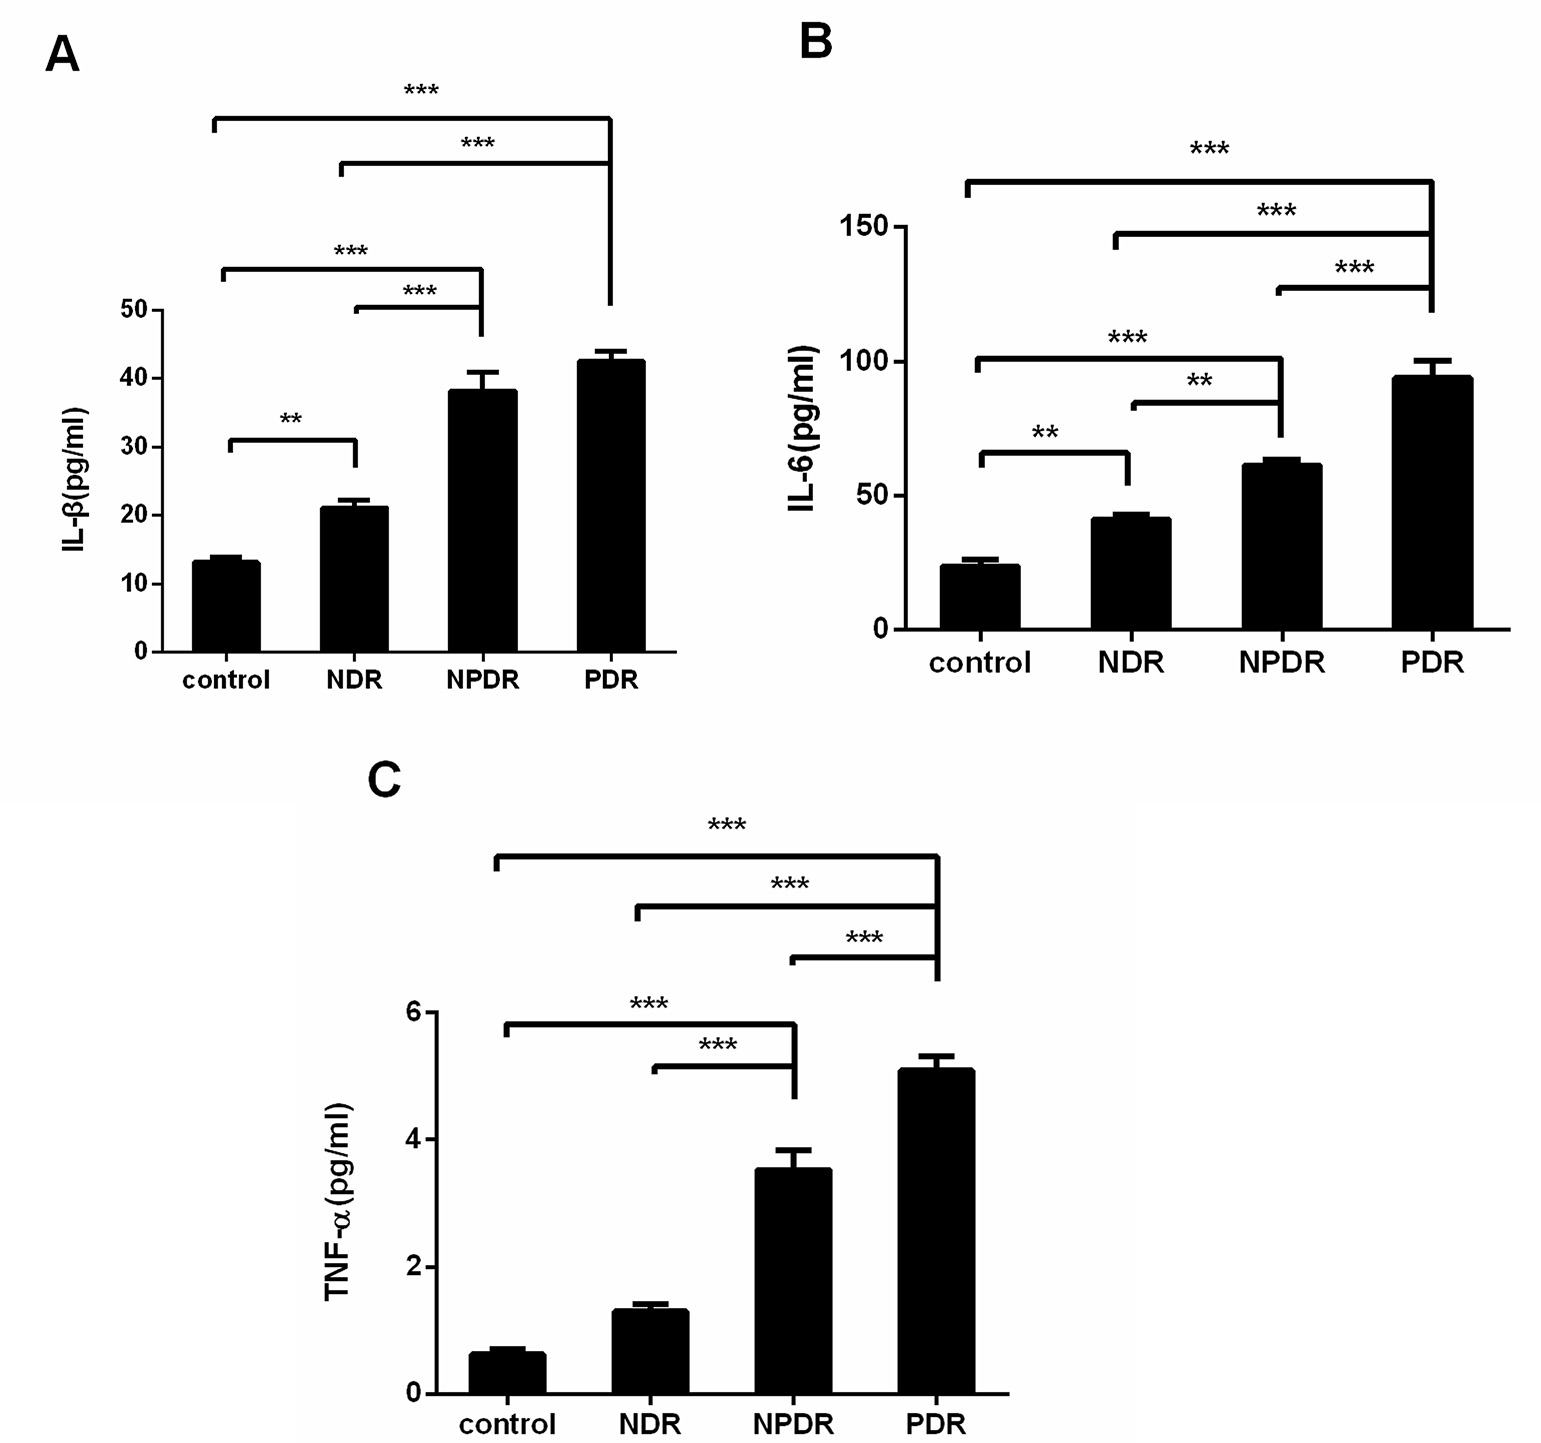
 Figure 3 of
Chen, Mol Vis 2023; 29:160-168.
Figure 3 of
Chen, Mol Vis 2023; 29:160-168.