Figure 2. The protein expression of SIRT6 and NMNAT2 was decreased in DR patients (PDR, n = 26; NPDR, n = 26; NDR, n = 25; controls, n = 27). Western blot analysis (lane 1, the control; lane 2, NDR; lane 3, NPDR; lane 4, PDR) and quantification of SIRT6 and NMNAT2 expression in PBMCs. β-actin was included as a reference. *p < 0.05, **p < 0.01, and ***p < 0.001.
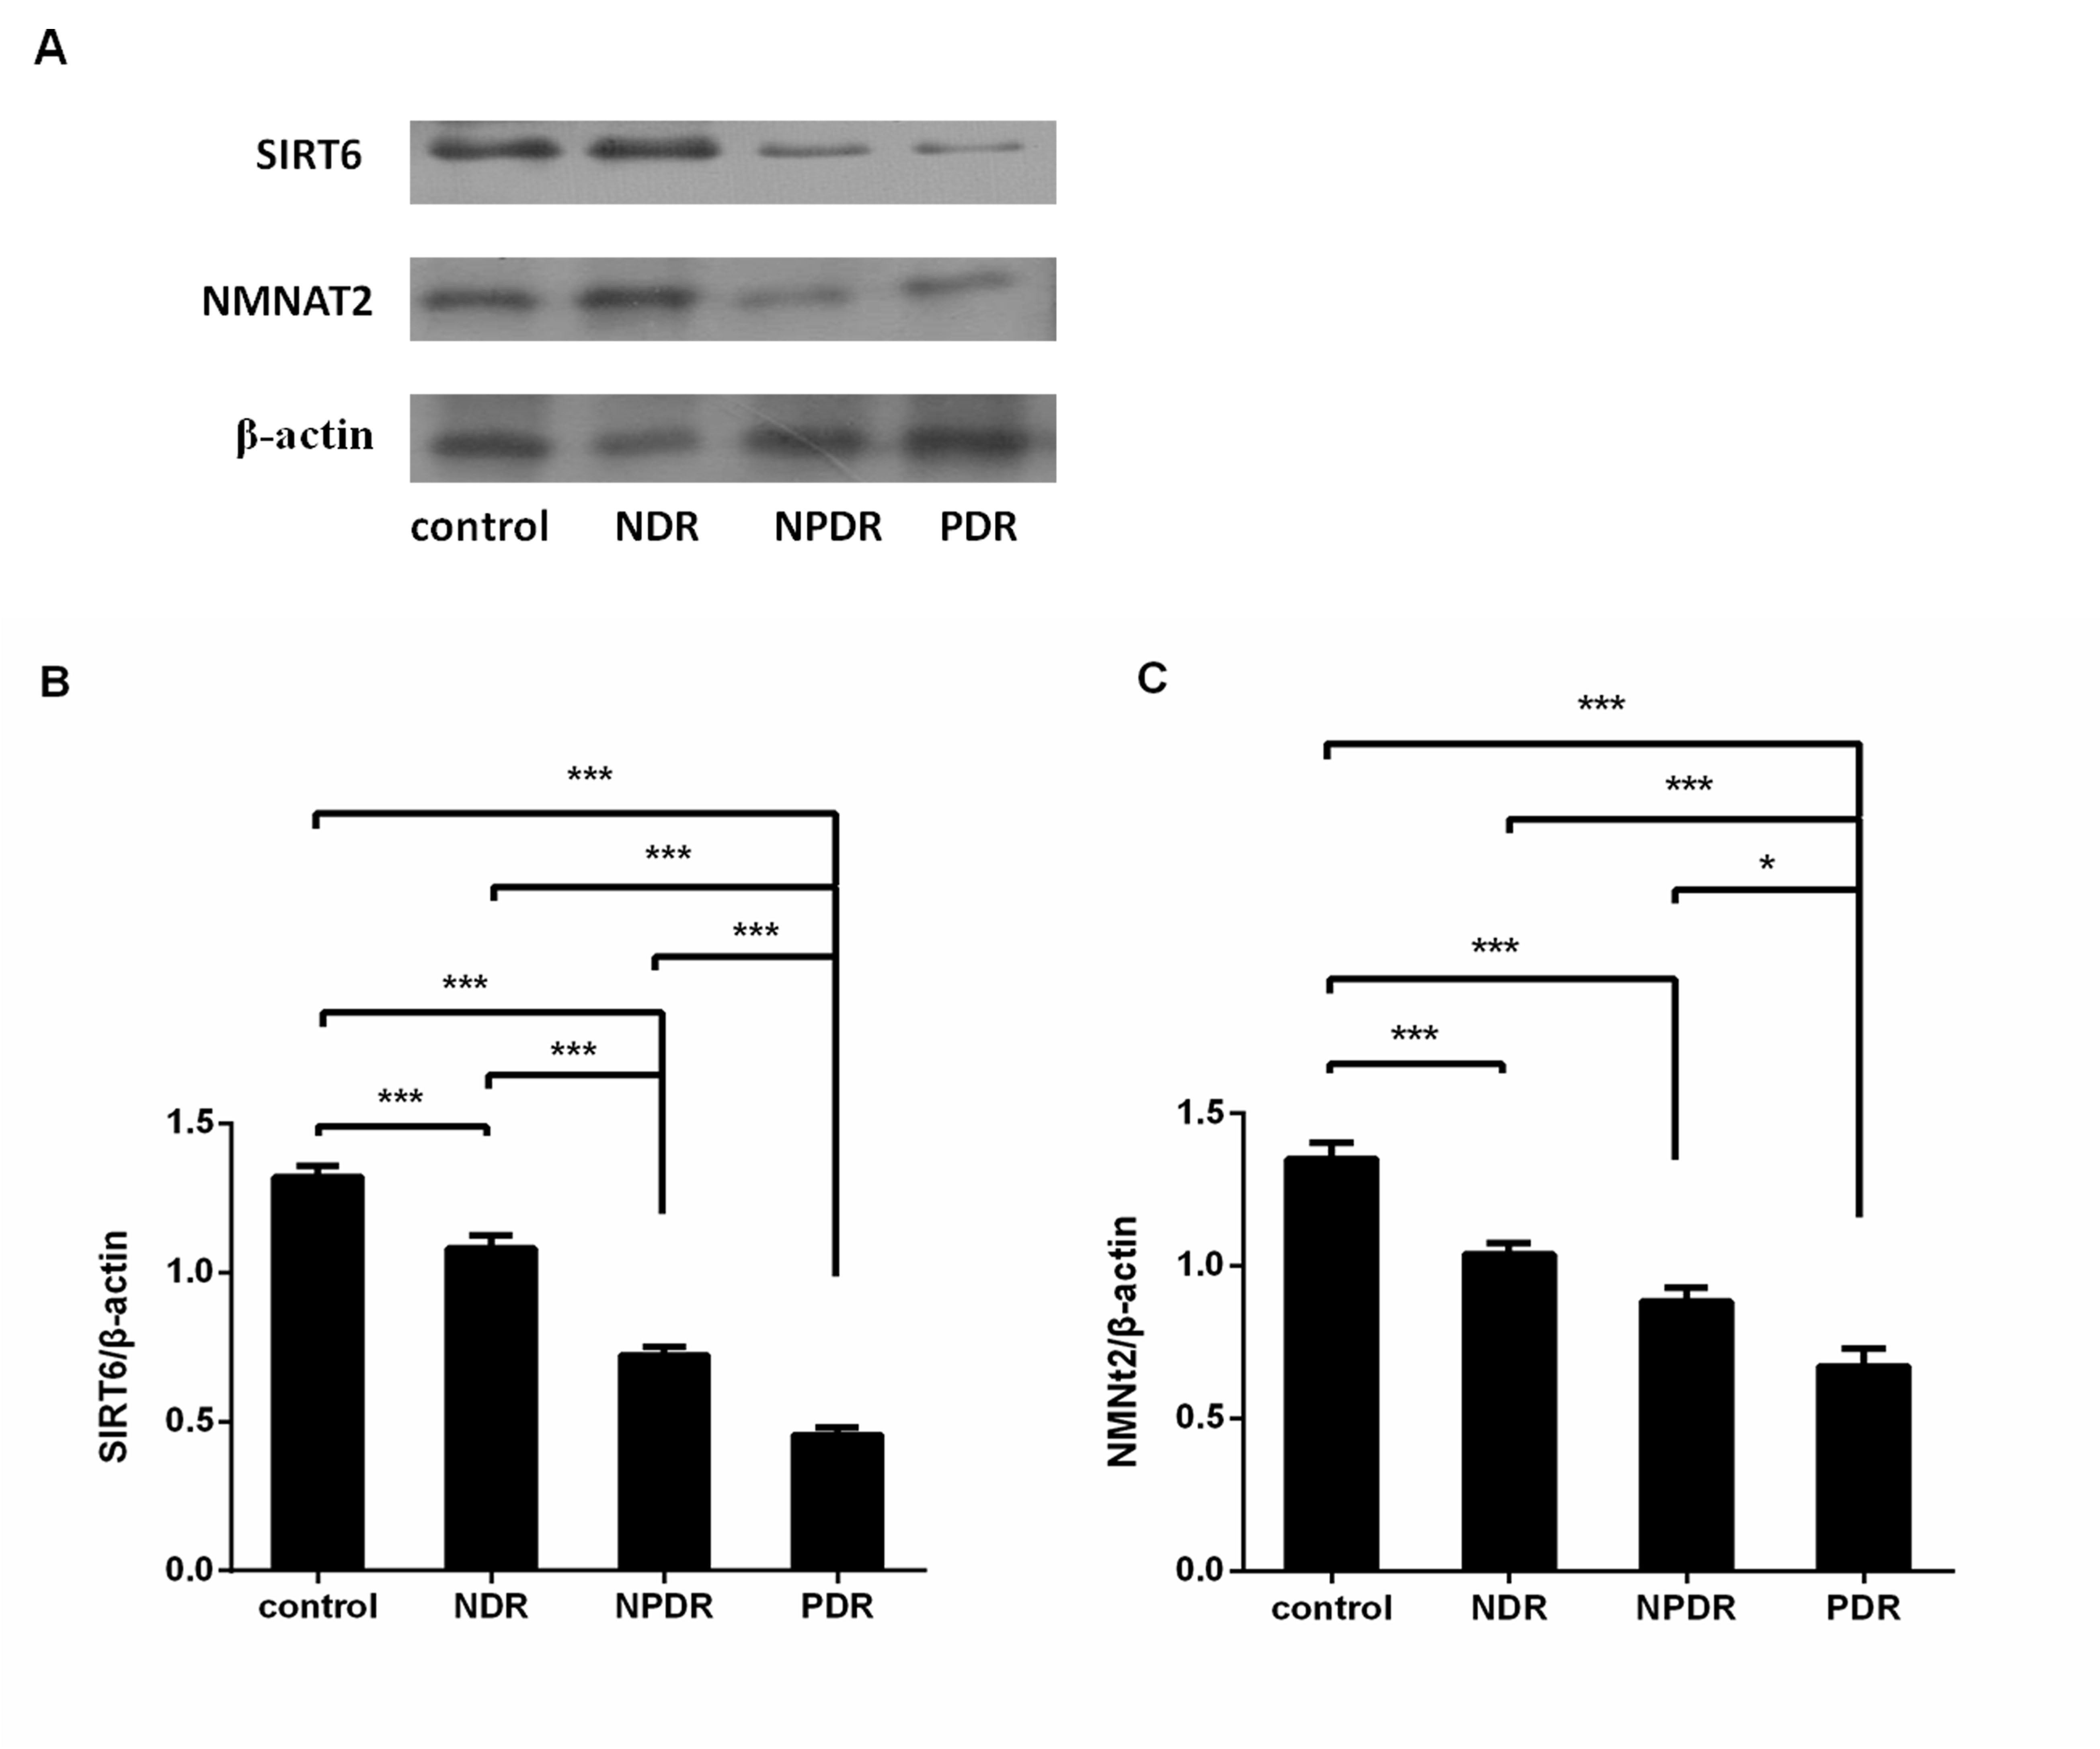
 Figure 2 of
Chen, Mol Vis 2023; 29:160-168.
Figure 2 of
Chen, Mol Vis 2023; 29:160-168.