Figure 1. The mRNA levels of SIRT6 and NMNAT2 were downregulated in DR patients. The mRNA expression of SIRT6 and NMNAT2 in the PBMCs was quantified by real-time PCR and normalized to the level of β-actin. (PDR, n = 26; NPDR, n = 26; NDR, n = 25; controls, n = 27). Values are presented as fold-changes when compared with the controls. *p < 0.05, **p < 0.01, and ***p < 0.001.
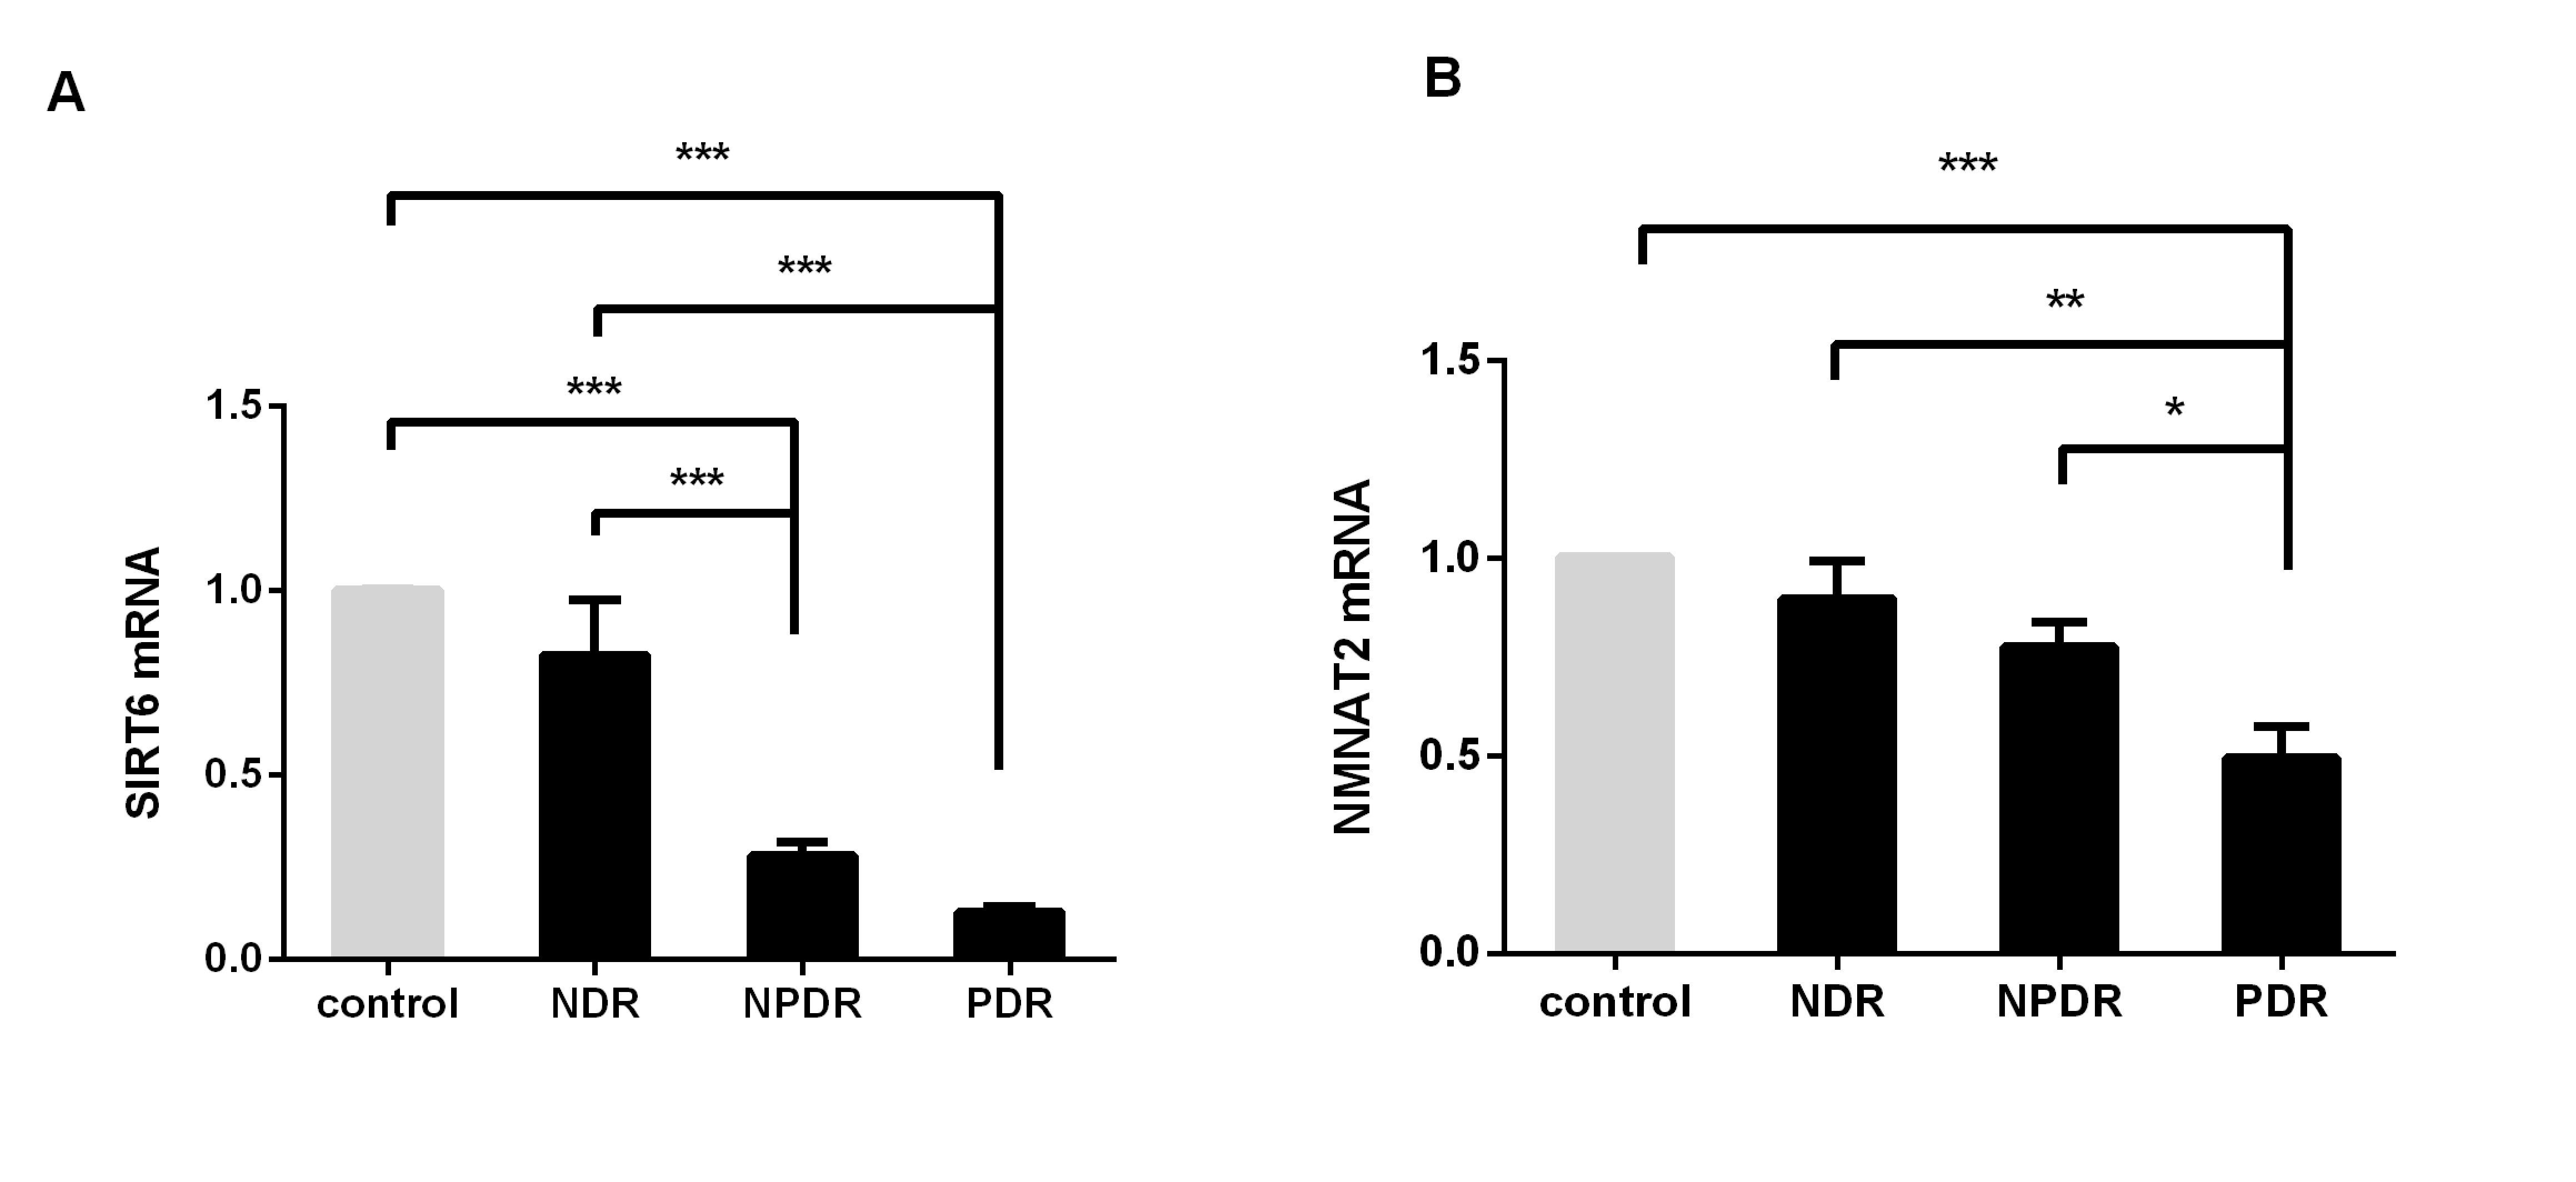
 Figure 1 of
Chen, Mol Vis 2023; 29:160-168.
Figure 1 of
Chen, Mol Vis 2023; 29:160-168.