Figure 3 of
Tran, Mol Vis 2023; 29:140-152.
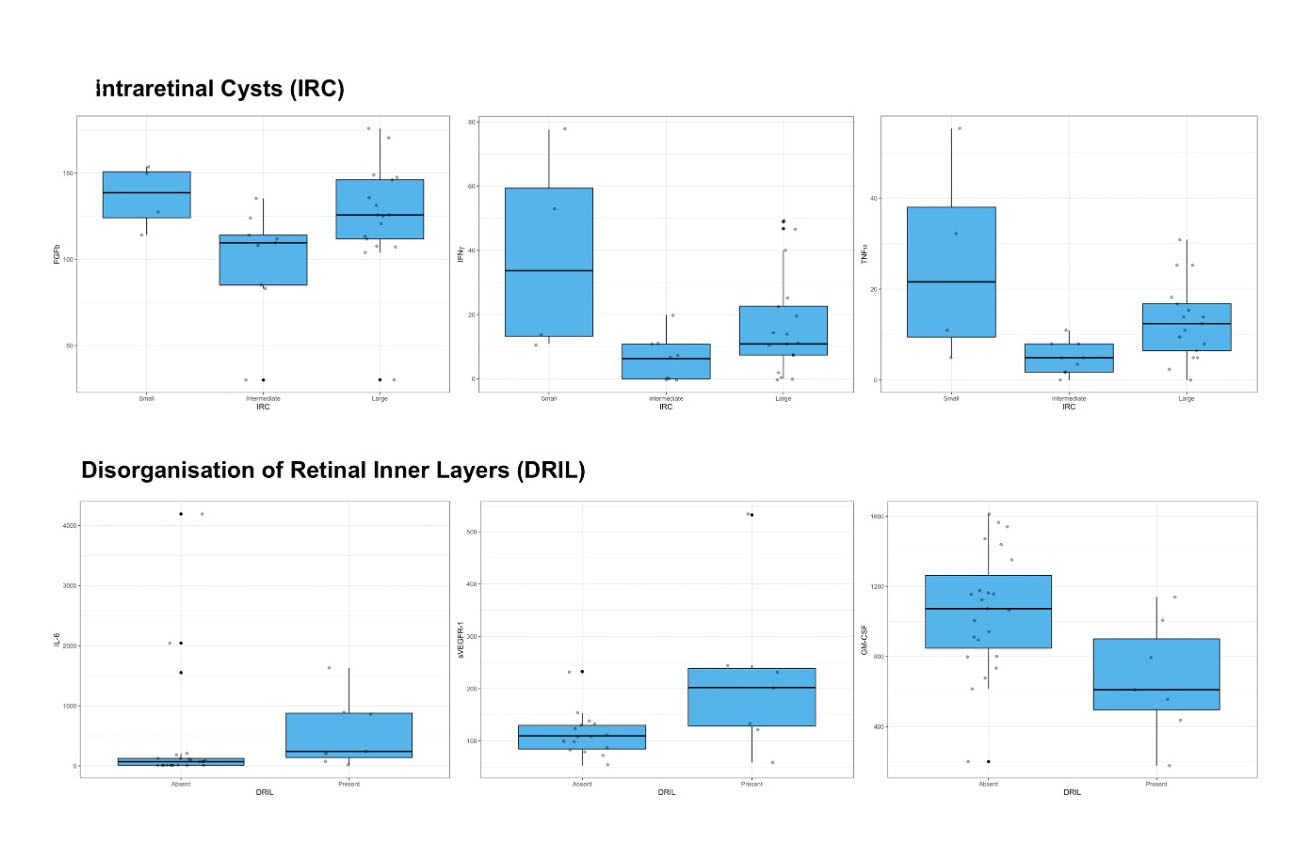
Figure 3.
Plots showing the relationship of aqueous cytokine concentrations with optical coherence tomography features of eyes with diabetic macular edema at baseline.
 Figure 3 of
Tran, Mol Vis 2023; 29:140-152.
Figure 3 of
Tran, Mol Vis 2023; 29:140-152.