Figure 2. Boxplots of the best-corrected vision, central macular thickness, and macular volume with respect to low versus high cytokine
expression profile. BCVA, best-corrected visual acuity (letters); CMT, central macular thickness (microns); MV, macular volume
(mm3).
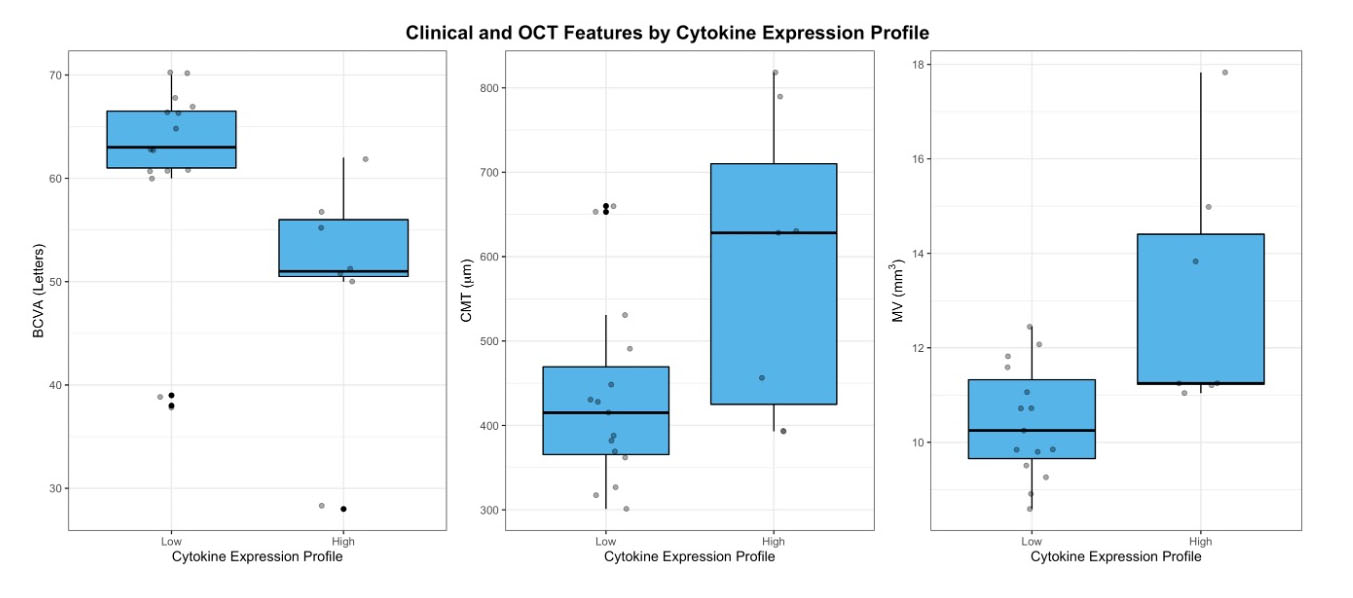
 Figure 2 of
Tran, Mol Vis 2023; 29:140-152.
Figure 2 of
Tran, Mol Vis 2023; 29:140-152.