Figure 1 of
Tran, Mol Vis 2023; 29:140-152.
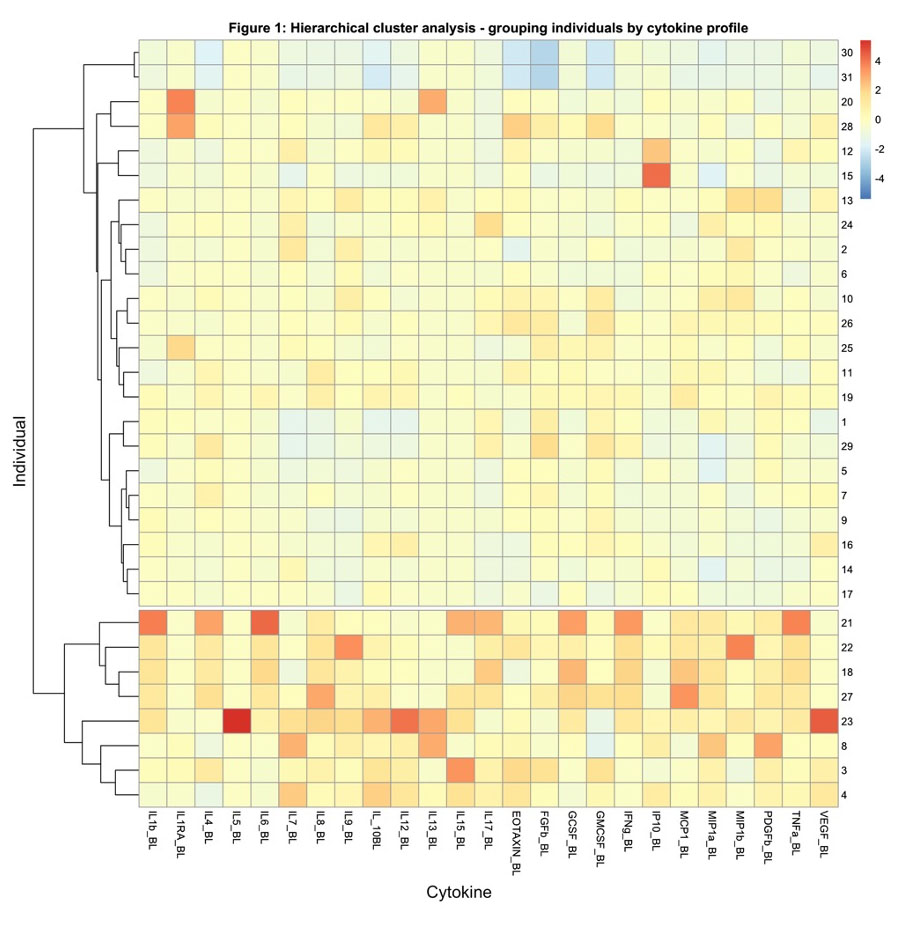
Figure 1.
Heat map of hierarchical cluster analysis by clusters of low and high cytokine expression.
 Figure 1 of
Tran, Mol Vis 2023; 29:140-152. Figure 1 of
Tran, Mol Vis 2023; 29:140-152.
Figure 1 of
Tran, Mol Vis 2023; 29:140-152. Figure 1 of
Tran, Mol Vis 2023; 29:140-152.