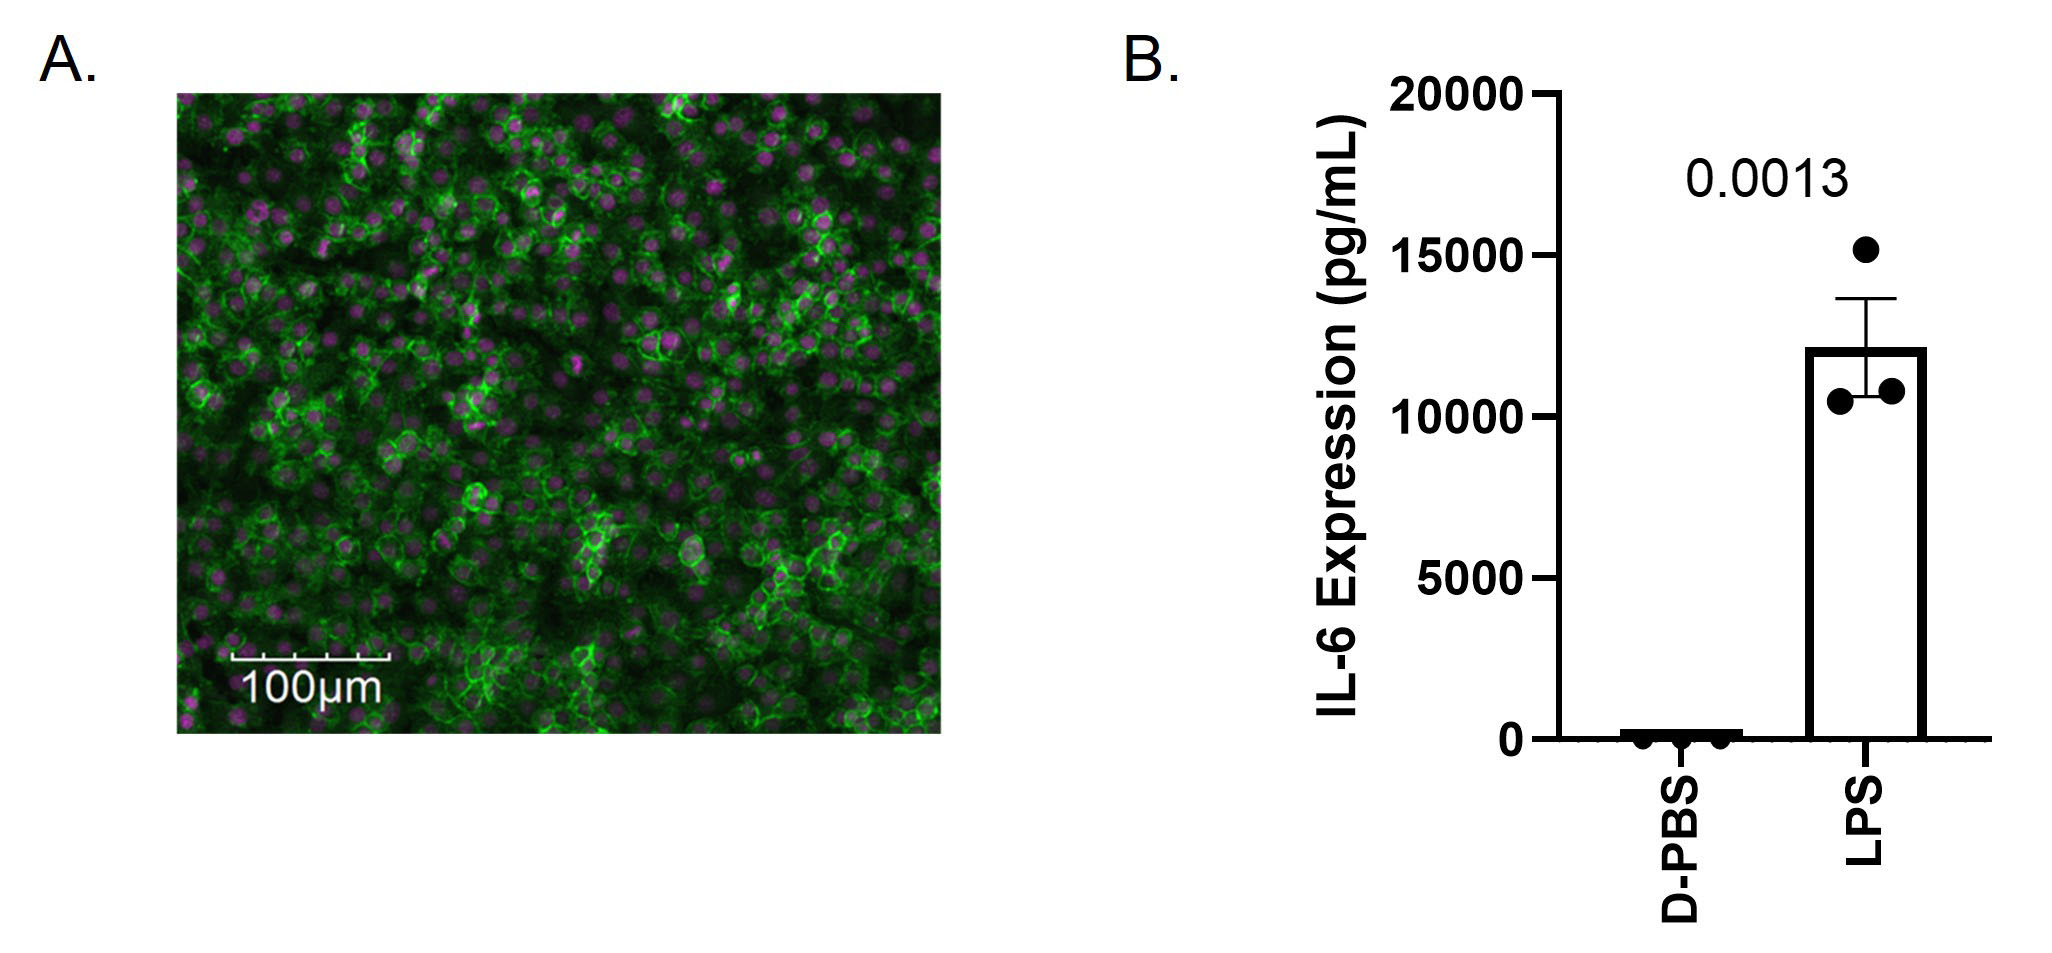
Figure 5. RAW 264.7 cells express basigin-2 and LPS-induced IL-6.
A: Immunocytochemical analyses of RAW 264.7 using an antibody specific for basigin gene products [
10] and Alexa 488-conjugated goat-anti-rabbit secondary antibody. Basigin-2 expression is represented by green fluorescence,
and nuclear DNA is represented in purple. The magnification bar represents 100 μm.
B: Interleukin-6 (IL-6) present within the cell culture medium of RAW 264.7 cells treated with D-PBS or lipopolysaccharide
(LPS: 1 μg/ml) for 24 h at 37 °C was measured via quantitative enzyme-linked immunosorbent assay (ELISA) and plotted as the
mean concentration (pg/ml) of triplicate runs. The error bars represent the standard deviation of the mean. An unpaired
t test was performed. The p values are indicated (α level = 5%).
 Figure 5 of
Solstad, Mol Vis 2023; 29:13-24.
Figure 5 of
Solstad, Mol Vis 2023; 29:13-24.