Figure 2. The basigin-1 Ig0 domain binds to basigin-2. A: Binding assays were performed using Ig0–6XHis (black circles) and C-6XHis (white circles) recombinant proteins with endogenous
basigin gene products captured from the mouse neural retina (NR), basigin-2 captured from the mouse brain (Brain), or bovine
serum albumin (BSA). The interaction was measured using an antibody specific to the six-histidine epitope at the C-terminus
of the recombinant proteins and a secondary antibody conjugated to alkaline phosphatase (AP). Conversion of the AP substrate
to the product was measured at 405 nm, and the absorbance was used as the binding units. The binding units were plotted as
the mean of the triplicate runs. The error bars represent the standard deviation of the mean. A two-way ANOVA with Tukey’s
multiple comparison test was performed. The p values are indicated (α level = 5%). B: An affinity binding curve was generated using serial dilutions of Ig0–6XHis from 5 μM to 0.3125 μM with endogenous basigin
gene products captured from the mouse neural retina. Interactions were measured as described for the binding assays. Absorbance
at 405 nm was used to determine percent binding in reference to the 5 μM sample. The percent binding was plotted as the mean
of duplicate runs. The error bars represent the standard deviation of the mean. The equation from the trendline was used to
calculate affinity.
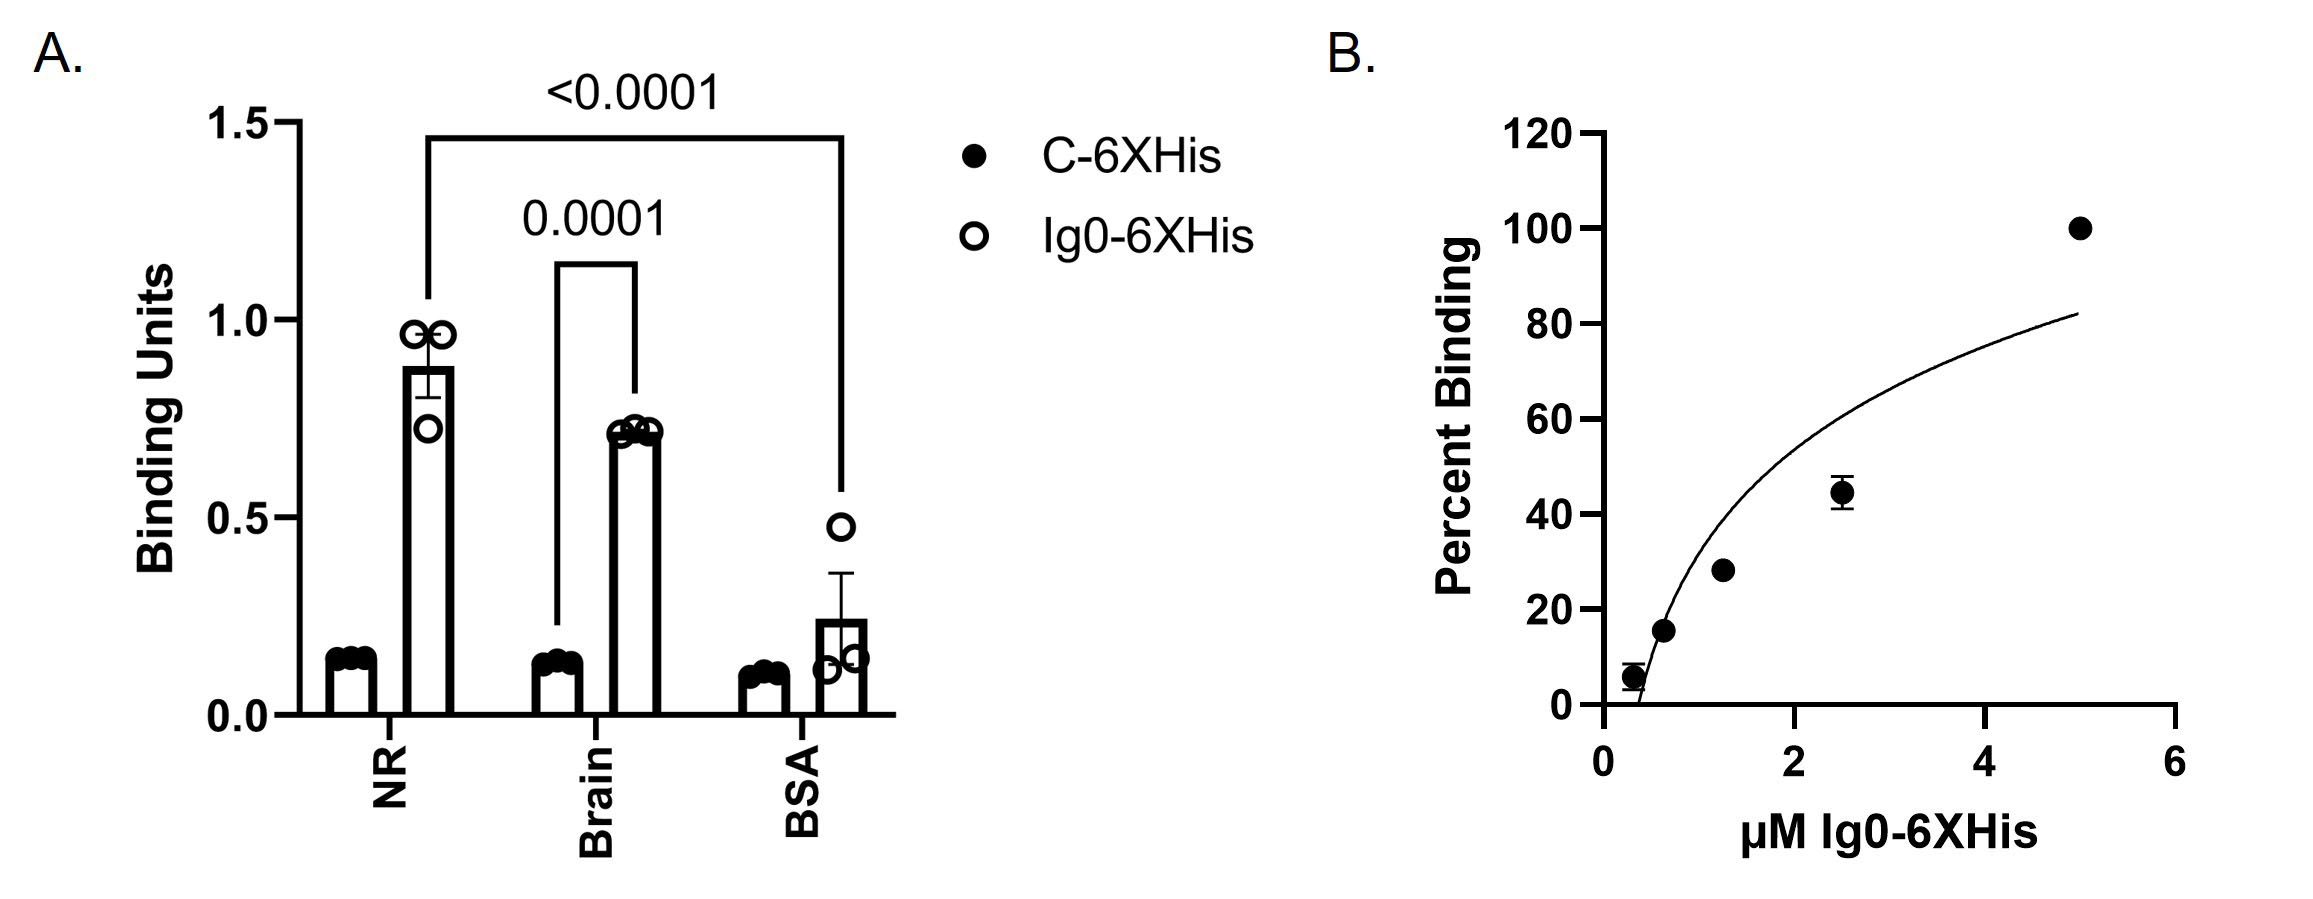
 Figure 2 of
Solstad, Mol Vis 2023; 29:13-24.
Figure 2 of
Solstad, Mol Vis 2023; 29:13-24.