Figure 8. pAKT, NFκB, and BCL-2 protein expression upon LOX-PP overexpression. A: Y79 cells were overexpressed with LOX-PP, and whole-cell protein was extracted and subjected to western blot analysis for
pAKT (S473), total AKT, NFκB, and BCL-2. B: The bar diagram shows the quantification of pAKT normalized with β-actin. C: The bar diagram shows the quantification of NFκB normalized with β-actin. D: The bar diagram shows the quantification of BCL-2 normalized with β-actin. Values were expressed as mean ± SD, n=3. (Student
t test statistical analysis was used; ***p<0.001, **p<0.01, and *p<0.05, when compared with EV) (EV, empty vector).
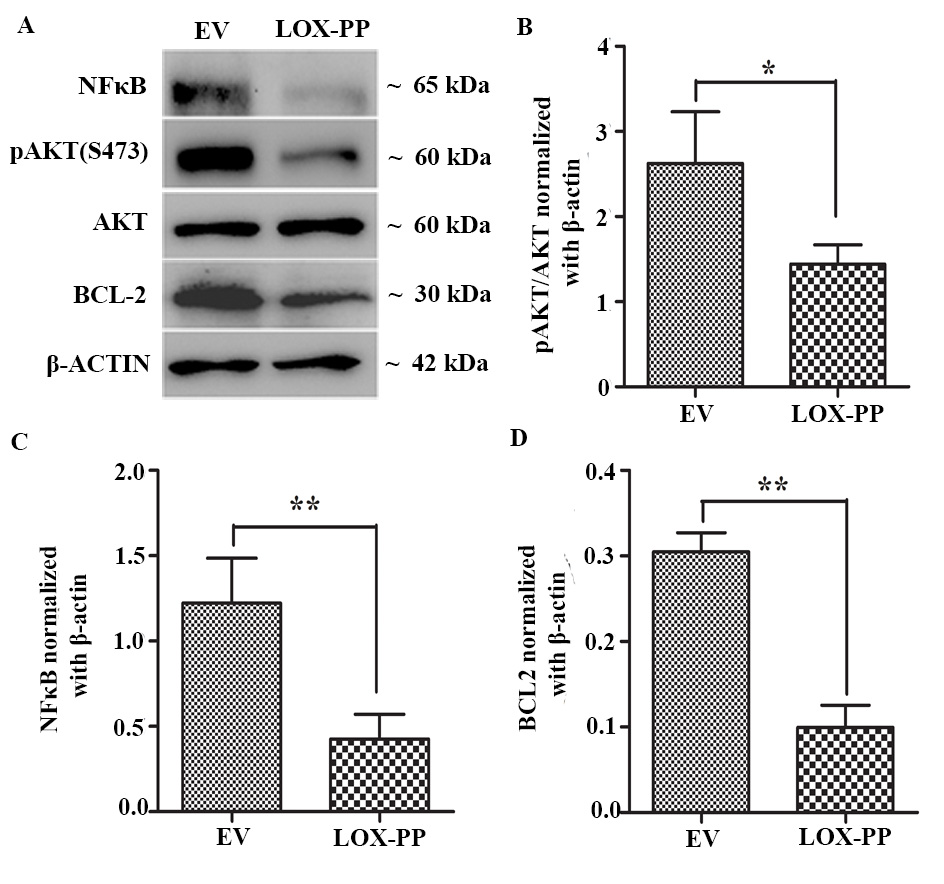
 Figure 8 of
Nagaraj, Mol Vis 2023; 29:125-139.
Figure 8 of
Nagaraj, Mol Vis 2023; 29:125-139.