Figure 7. The role of LOX-PP in the cell cycle events in RB. A: Flow cytometric analysis and propidium iodide stain showing the percentage of cells in G2, S, and G1. B: Representative bar diagram of cell cycle analysis. C: Western blot analysis showing the expression of Cyclin D1 in Y79 cells were overexpressed with LOX-PP. D: The bar diagram represents the quantification of Cyclin D1 normalized with β-actin. E: Western blot for Cyclin D1 in Y79 cells upon treatment with 2.5µg/ml of rLOX-PP. F: The bar diagram shows the quantification of Cyclin D1. Values were expressed as mean ± SD, n=3. (Student t test statistical analysis was used; ***p<0.001,**p<0.01, and *p<0.05, when compared with EV and vehicle control) (EV, empty
vector; RB, retinoblastoma).
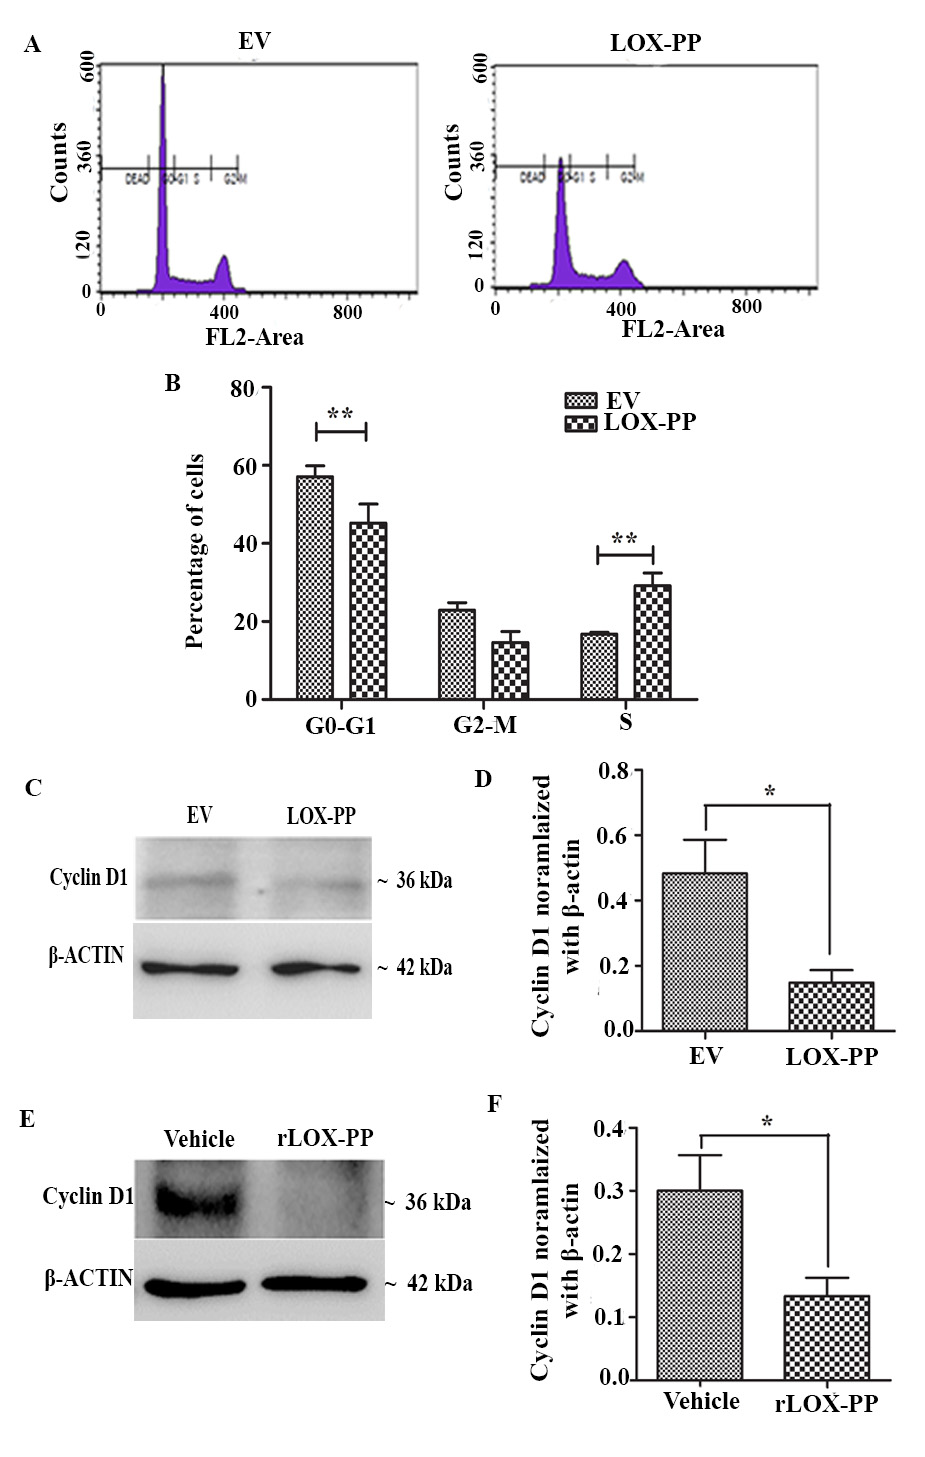
 Figure 7 of
Nagaraj, Mol Vis 2023; 29:125-139.
Figure 7 of
Nagaraj, Mol Vis 2023; 29:125-139.