Figure 4. Pathway analysis on microarray data of Y79 RB cells upon LOX-PP overexpression. Representation of RB, cell cycle, and PI3K-AKT-Focal
adhesion pathway highlighting gene regulation upon LOX-PP overexpression. Red indicates upregulation of genes with the overexpression
of LOX-PP, while green indicates downregulation compared to empty vector. (RB, retinoblastoma).
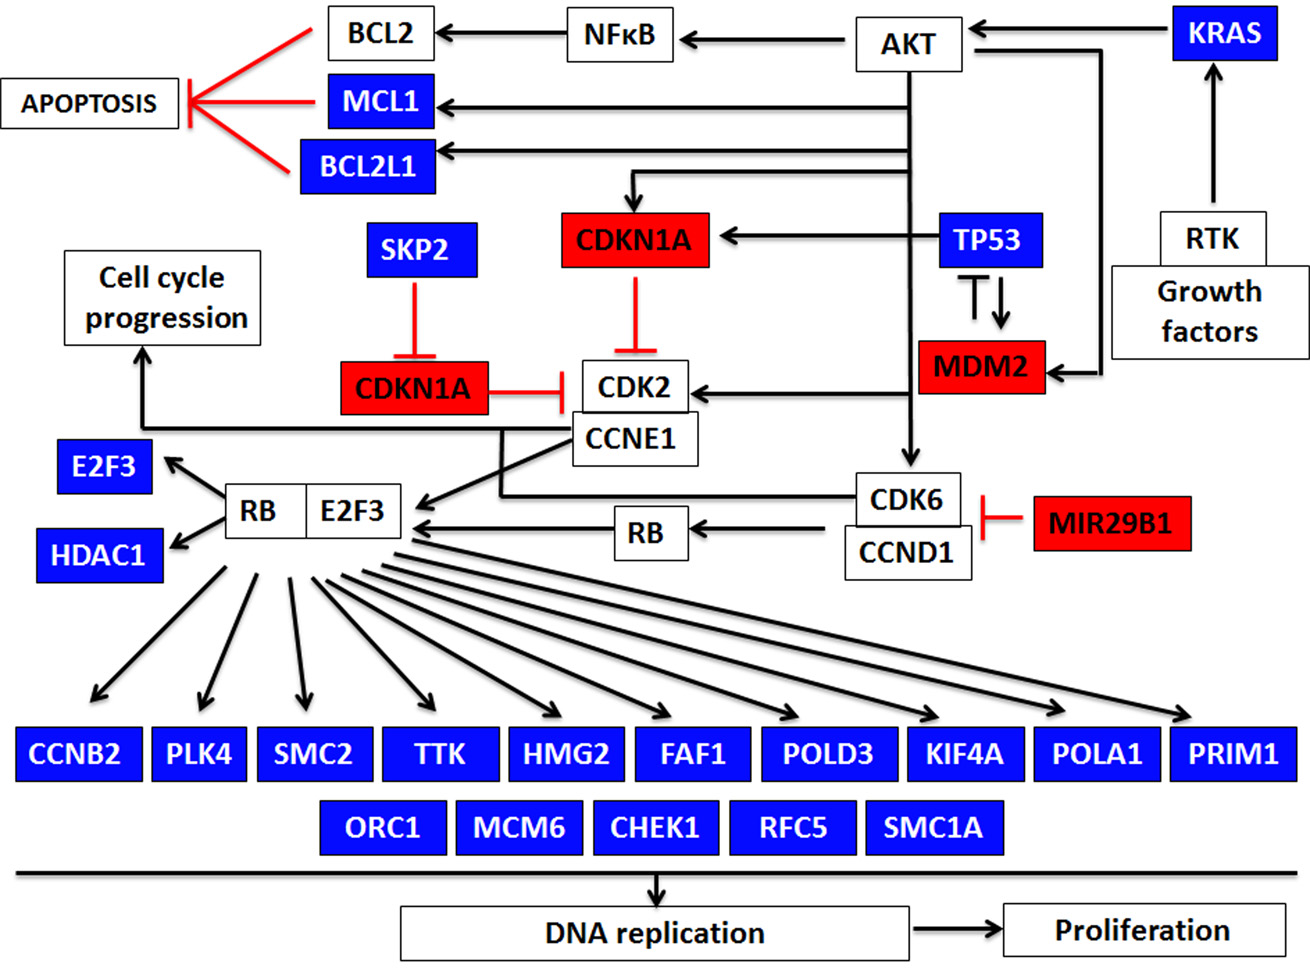
 Figure 4 of
Nagaraj, Mol Vis 2023; 29:125-139.
Figure 4 of
Nagaraj, Mol Vis 2023; 29:125-139.