Figure 3. Microarray analyses in Y79 cells overexpressed with LOX-PP. A: Heatmap of differentially expressed genes in LOX-PP overexpressed Y79 cells. B: List of pathways deregulated upon LOX-PP overexpression. C: Microarray data validation by quantitative PCR for TP53 (p<0.05), D: BCL2 (p<0.05), and E: MDM2 (p<0.05). Values were expressed as mean ± SD, n=3. (Student t test was used for statistical analysis; ***p<0.001, **p<0.01, and *p<0.05, when compared with EV) (EV, empty vector).
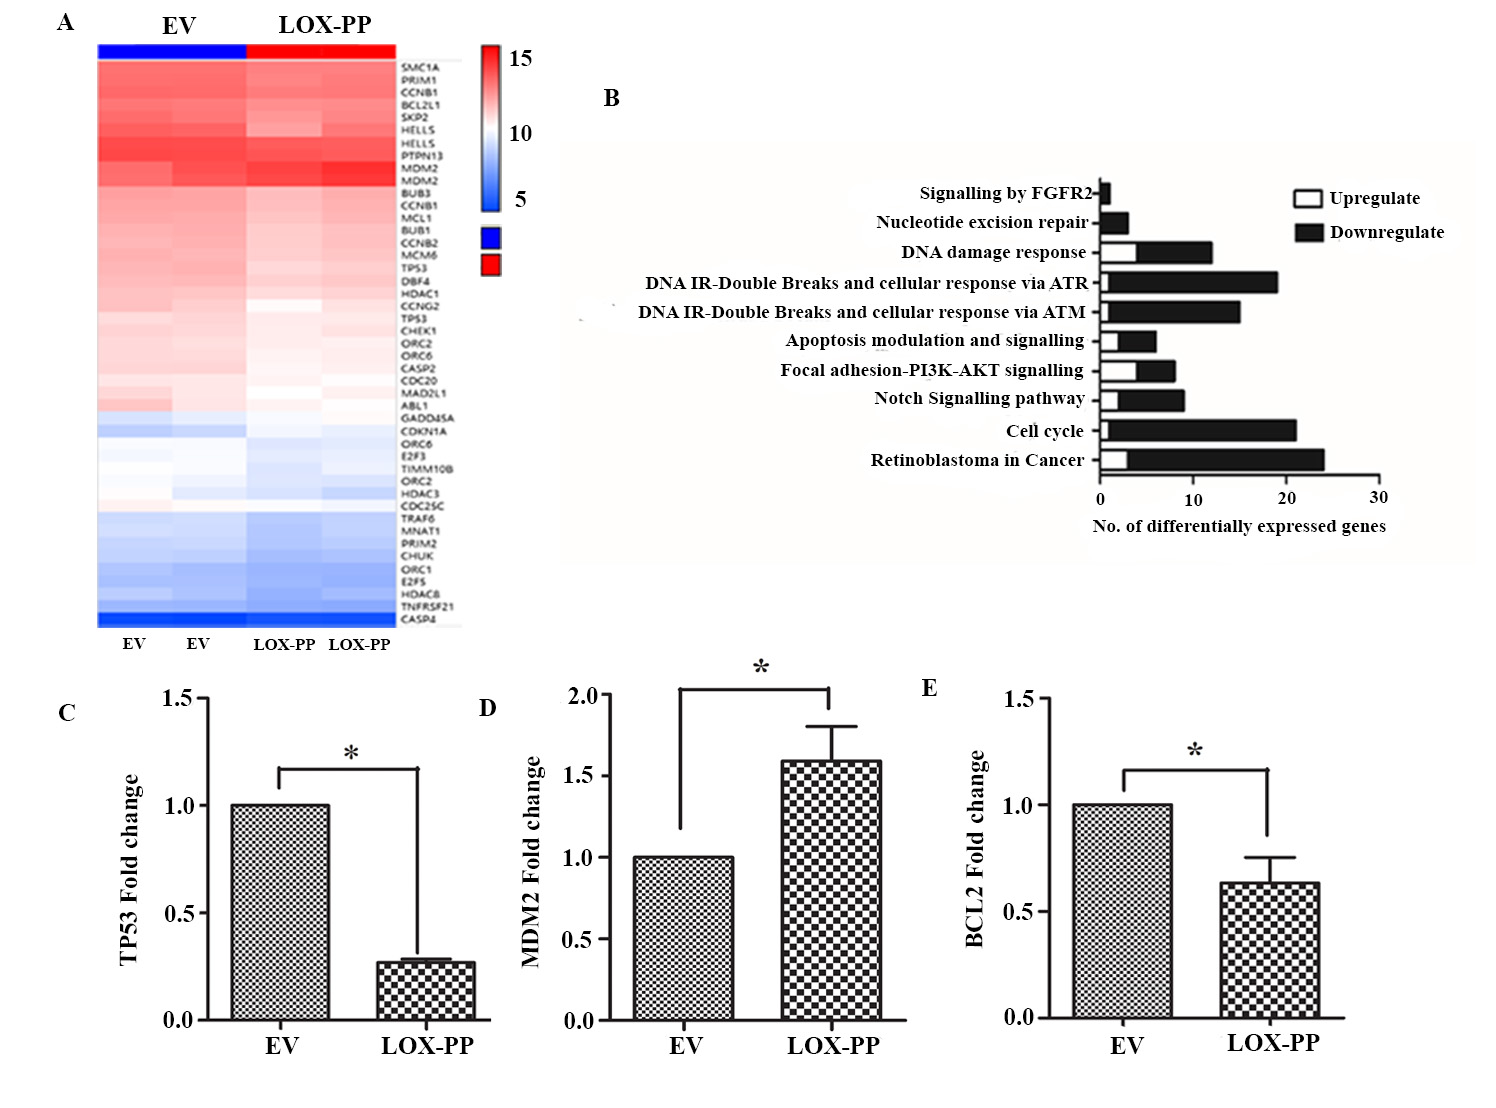
 Figure 3 of
Nagaraj, Mol Vis 2023; 29:125-139.
Figure 3 of
Nagaraj, Mol Vis 2023; 29:125-139.