Figure 2. LOX-PP overexpression in Y79 cells. A: Western blot analysis showing the overexpression of LOX-PP in cell extract normalized with a housekeeping gene, β-actin.
B: The bar diagram represents LOX-PP overexpression in cell extracts compared to EV in percentage, with a p value of less than
0.01. C: Western blot analysis showing the expression of secretary extracellular LOX-PP normalized with a loading control. D: The bar diagram represents LOX-PP overexpression in conditioned medium compared to EV in percentage with a p value of 0.042.
Values were expressed as mean ± SD, n=3. (Student t test was used for statistical analysis; ***p<0.001, **p<0.01, and *p<0.05, when compared with EV) (EV, empty vector).
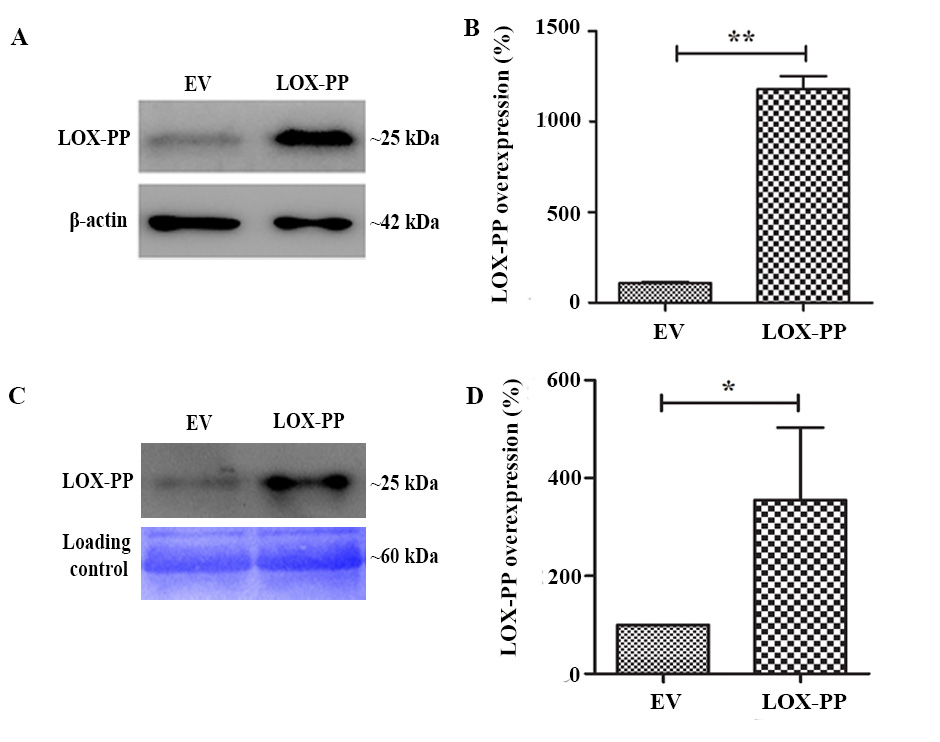
 Figure 2 of
Nagaraj, Mol Vis 2023; 29:125-139.
Figure 2 of
Nagaraj, Mol Vis 2023; 29:125-139.