Figure 10. pAKT, NFκB, and BCL-2 protein expression on wortmannin-treated rLOX-PP exposed cells. A: Western blot analysis showing the expression of pAKT (S473), AKT, NFκB, and BCL-2 in Y79 cells were treated with 2.5 µg/ml
of recombinant LOX-PP and 2.5 µg/ml of recombinant LOX-PP + 1 μM wortmannin. B: The representative bar diagram shows the quantification of pAKT normalized with β-actin. C: The representative bar diagram shows the quantification of NFκB normalized with β-actin. D: The representative bar diagram shows the quantification of BCL-2 normalized with β-actin. Values were expressed as mean ±
SD, n=3. (One-way ANOVA statistical analysis was used; ***p<0.001, **p<0.01, and *p<0.05, when compared with vehicle control).
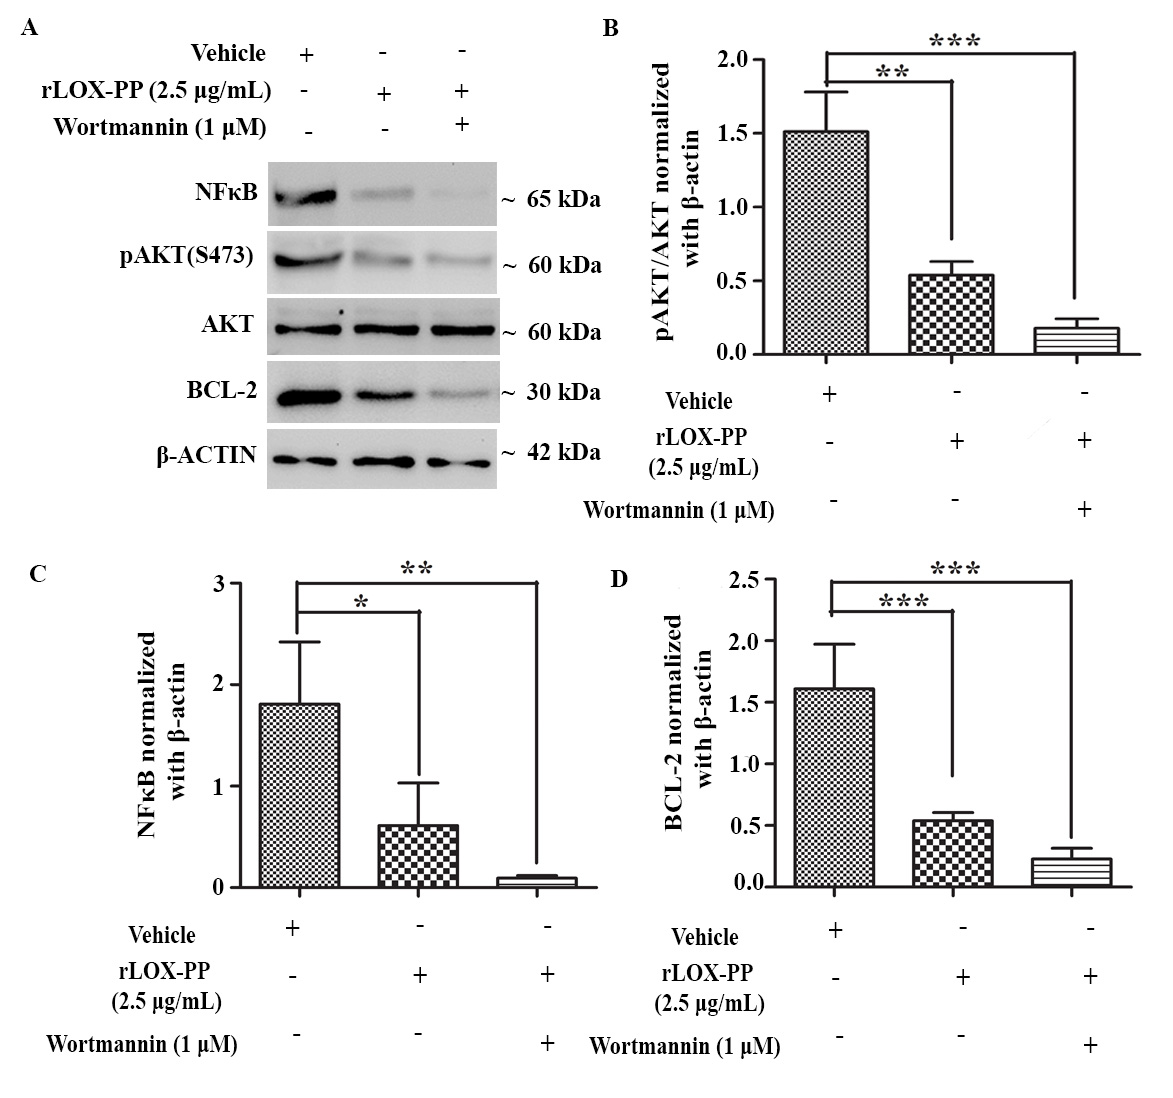
 Figure 10 of
Nagaraj, Mol Vis 2023; 29:125-139.
Figure 10 of
Nagaraj, Mol Vis 2023; 29:125-139.